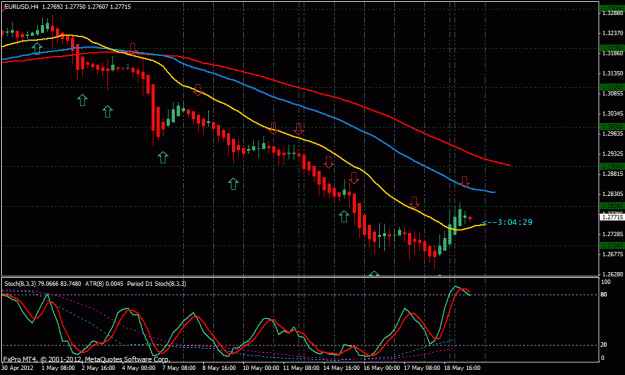
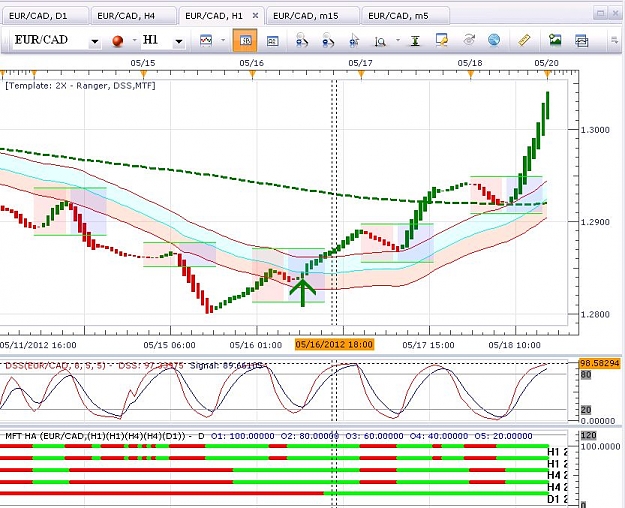
Hi Hugh, I wanted to share with you one of my tweeks. I am developing this guided by your ideas and my need to have visuals that are "easy" on my eyes. This is the layout that I am using to try to portray trend. This chart is the H1 EURCAD chart from this afternoon, but you can see from the tabs that I use a MTF analysis(D1,H4,H1,M15,M5). While I trade off the H1 chart, I try to find my entries/exits on the M15 chart.
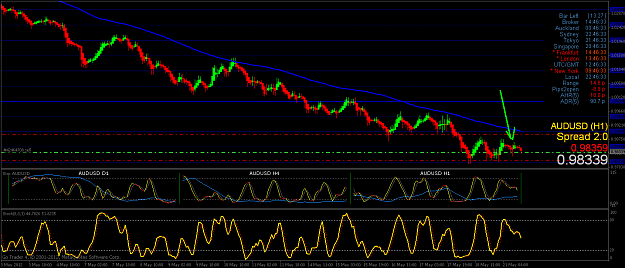
I like this picture a lot. It shows SMOOTH periodicity in price, stoc and HA over the last 5 days with a nice turn in trend. I wish that I had been trading it, but I am still massaging my charting - pretty much there, thank God.
Notes: 1) HA candles are smoothed, no wicks, with a 1 CANDLE offset. 2) the HA Heat Map at the bottom is the True candle color(not smoothed). 3) the Heat Map shows the current TF in the top 2 lines, then 1 TF up (H4) for 2 lines and finally the bottom line is the D1 trend line 4) the Keltner channel is set for 50 MVA and ATR=1. the colored blocks are daily time blocks, EST - Pink=12MN to 8AM, blue=8AM to 5PM and white=5PM to MN. Roughly corresponding to the major trading blocks around the world.
Notice how nicely the price action "conforms" or "respects" the Keltner cloud, a little bit like a poor man's Ichimoku Cloud but a lot smoother. In this example going with the H1 trend would have really paid off, with or without M15 input.
This pattern occurs surprisingly often. Just something else to look for.
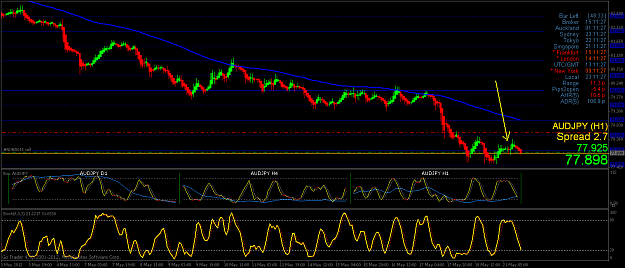
Attached Image (click to enlarge)
Do not dwell in the past, do not dream of the future, concentrate the mind.