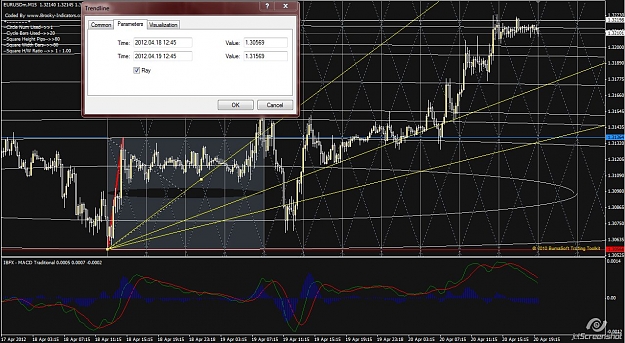
DislikedI genuinely hope people can pay a little bit attention to their reading. Regarding Gann angles or Gann Fan, it's all been very clearly explained in materials in a few simple sentences of a very clear example, within a book of about 99 pages including all the padding and appendix. The attached chart shows two sets of Gann angle lines: red and yellow. The red ones are drawn based on some of the discussion here that one has to take two low points A&B(one original one snap back) and calculate the time inbetween. The yellow ones are calculated from one...Ignored
This needs to be added to the Moneydeep Indi.
BTW. The moneydeep indicator does not let you move the line with the (HiLo) function on false. Maybe that can be fixed. Thanks.
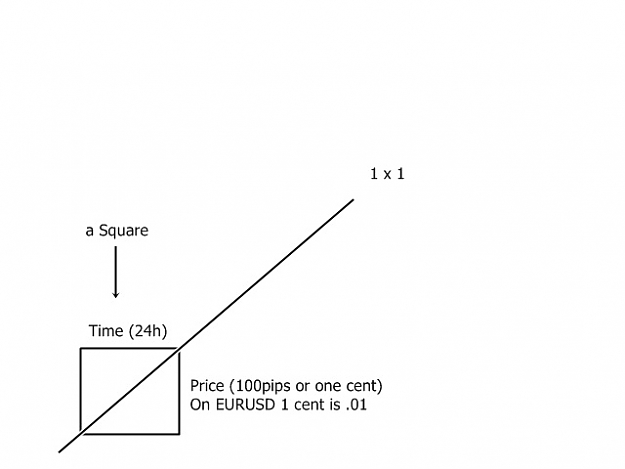
Matei: Gann used code language. Angle = Aspect, price = time
So if you know the "angle" of a stock you will know where (at which price) it will turn (when time and price meet, and they meet at an angle)
However, here we are trying to follow the trend until it turns.
Buy when it goes up, sell when it goes down.
In the end you get the same result as Gann. Gann knew when price was going to turn, but then he had to confirm the turn. That means he did not get into the market at the point that price and time met, but when he confirmed that it reacted according to his forecast.
Well, you can do the same thing without the complicated forecast and get a high probability trade as I described earlier.