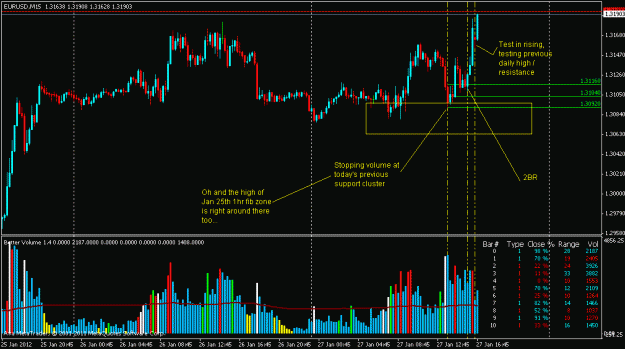
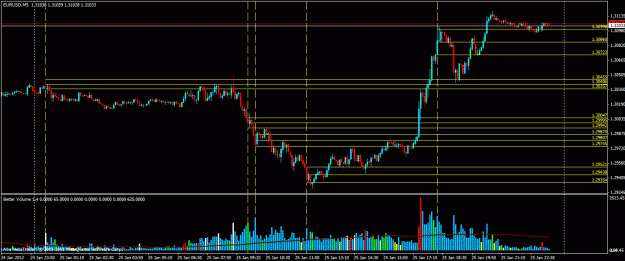
I am posting a 5min chart not to specifically show any one entry (I was both short and long EU yesterday) but to show a few things... (although in writing the post I do talk a few entries  )
)
I started with a clean chart, removed all my fibs (well not really I just opened a new chart and loaded my VSA profile... I wanted to make it sound like I sacrificed my live charts for this exercise
  )
)
Anyway I digress...
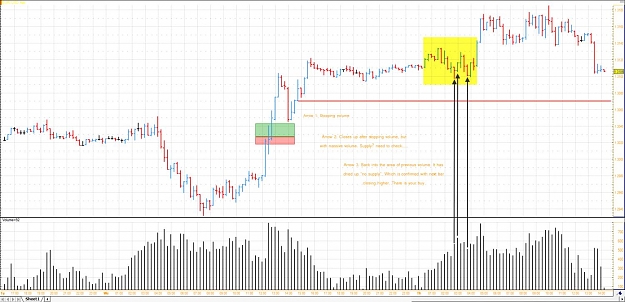
1. I have marked on the bars I see as important (in hindsight)... some are UHV in the overall scheme, some are UHV based on time of day... notice also that for this example I am ignoring the WRB's... they tell stories too but for this chart they weren't overly important to me. I then compared this chart to my live chart and all in all it was close but not exact.
Now just look at the chart and see why I chose the bars I did... you may or may not agree and that is quite already but at least understand my choices. Every bar I marked was important to today's PA and at some point controlled it even if only for a short time.
There are trades on there, quite a few actually, both short and long and then actually short again. There was even a nice 2BR into 50% of the top fib but I didn't short it because of the fact overall we had more SOS than SOW and the previous dip proved that as we quickly found support back at a zone which provided resistance earlier in the day... Resistance turned Support, Demand where Supply once stood... exactly. That is how the market operates.
2. The main reason for this post is to draw attention to that "odd" Asia volume spike... while small compared to the later spikes for the time of day it was signifcant and odd. All TF's show this spike clearly. Look where price was rejection multiple times before the drop off... no close ever above 50%. Even that UT rose all the way through only to fail and close below. 2 bars later a great ND below that UT which became the current control zone ( I didn't mark it because it overlaps the Asia one). Fast forward to the retrace we had after the upper fib zone printed... see wher support was found... Cool stuff IMHO.
I just love how price dances from zone to zone to zone... it's awesome, it's predictable and it's my way of levelling the SM playing field and tilting it more towards my favor.
I mean look at the 2 middle zone (below Asia and above the low zone). The first one printed and then the second one... price moved up and was rejected at the low of the zone just above... push down through both zone and a move back up which was rejected at 50% of the lower of the two zones...
Then just to prove their worth as we danced along the high of the lowest zone we push up, get rejected at the low of the zone right above... back down rejection at 50% of the lowest zone another attempt to rise which makes a HH finding rejection this time at 50% of that lower middle zone, make a HL and then we get the push up through the 2 middle zones only to hit the breaks as we move into the Asia / UT combo zone... touch it retrace weakless a beauty NS and another push up... but see it doesn't go easy as it takes 4 bars and some effort to push through the remaining supply... again this is how the market works... no straight lines, supply, demand, cause, effect, effort, result and so on!
The effort it took to push through means that now we have demand orders built up where we once had supply orders, demand won the battle and supply retreated. Then demand set up shop, picthed their tents and found a new home. We didn't get far before demand took another hit of supply (upper fib zone) this time they let their foot off the gas and we retraced down to the demand camp and headed back up...
Lovely stuff... hopes others see the beauty in all of this... thanks to VSA.
I started with a clean chart, removed all my fibs (well not really I just opened a new chart and loaded my VSA profile...
Anyway I digress...
1. I have marked on the bars I see as important (in hindsight)... some are UHV in the overall scheme, some are UHV based on time of day... notice also that for this example I am ignoring the WRB's... they tell stories too but for this chart they weren't overly important to me. I then compared this chart to my live chart and all in all it was close but not exact.
Now just look at the chart and see why I chose the bars I did... you may or may not agree and that is quite already but at least understand my choices. Every bar I marked was important to today's PA and at some point controlled it even if only for a short time.
There are trades on there, quite a few actually, both short and long and then actually short again. There was even a nice 2BR into 50% of the top fib but I didn't short it because of the fact overall we had more SOS than SOW and the previous dip proved that as we quickly found support back at a zone which provided resistance earlier in the day... Resistance turned Support, Demand where Supply once stood... exactly. That is how the market operates.
2. The main reason for this post is to draw attention to that "odd" Asia volume spike... while small compared to the later spikes for the time of day it was signifcant and odd. All TF's show this spike clearly. Look where price was rejection multiple times before the drop off... no close ever above 50%. Even that UT rose all the way through only to fail and close below. 2 bars later a great ND below that UT which became the current control zone ( I didn't mark it because it overlaps the Asia one). Fast forward to the retrace we had after the upper fib zone printed... see wher support was found... Cool stuff IMHO.
I just love how price dances from zone to zone to zone... it's awesome, it's predictable and it's my way of levelling the SM playing field and tilting it more towards my favor.
I mean look at the 2 middle zone (below Asia and above the low zone). The first one printed and then the second one... price moved up and was rejected at the low of the zone just above... push down through both zone and a move back up which was rejected at 50% of the lower of the two zones...
Then just to prove their worth as we danced along the high of the lowest zone we push up, get rejected at the low of the zone right above... back down rejection at 50% of the lowest zone another attempt to rise which makes a HH finding rejection this time at 50% of that lower middle zone, make a HL and then we get the push up through the 2 middle zones only to hit the breaks as we move into the Asia / UT combo zone... touch it retrace weakless a beauty NS and another push up... but see it doesn't go easy as it takes 4 bars and some effort to push through the remaining supply... again this is how the market works... no straight lines, supply, demand, cause, effect, effort, result and so on!
The effort it took to push through means that now we have demand orders built up where we once had supply orders, demand won the battle and supply retreated. Then demand set up shop, picthed their tents and found a new home. We didn't get far before demand took another hit of supply (upper fib zone) this time they let their foot off the gas and we retraced down to the demand camp and headed back up...
Lovely stuff... hopes others see the beauty in all of this... thanks to VSA.
Attached Image (click to enlarge)
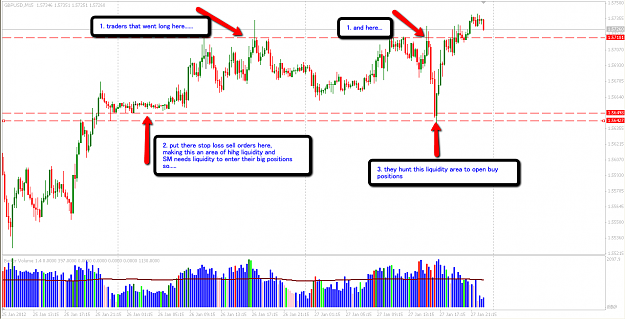
Today's zone = Tomorrow's opportunity!