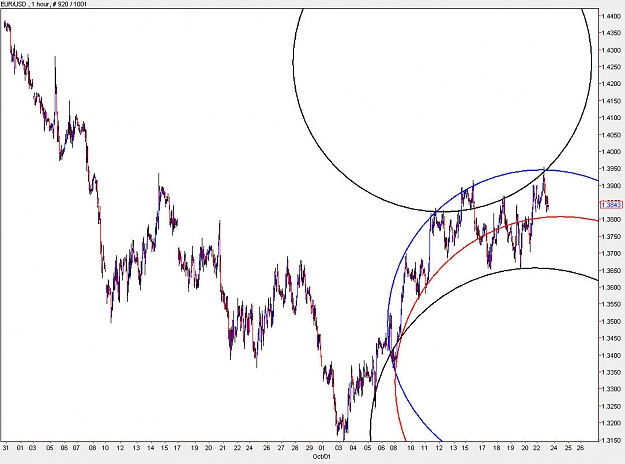
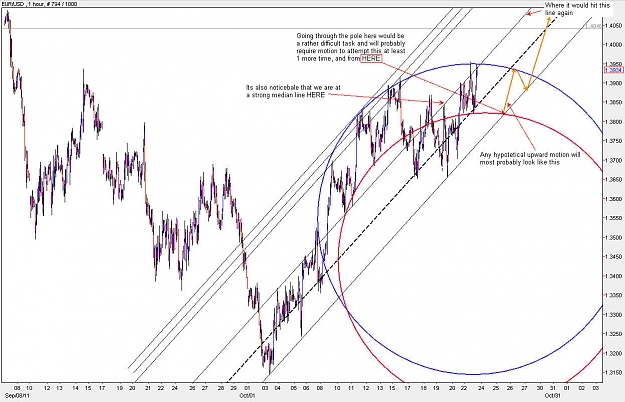
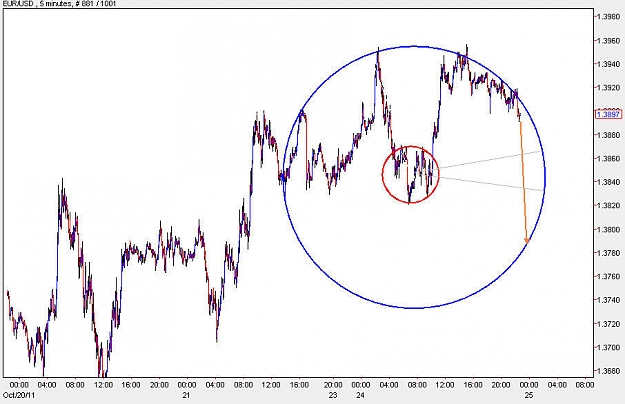
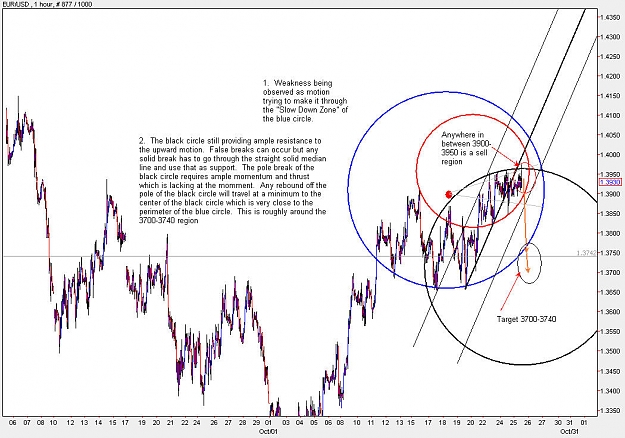
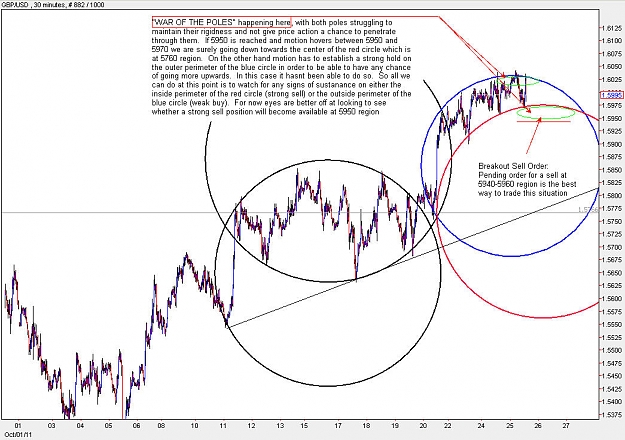
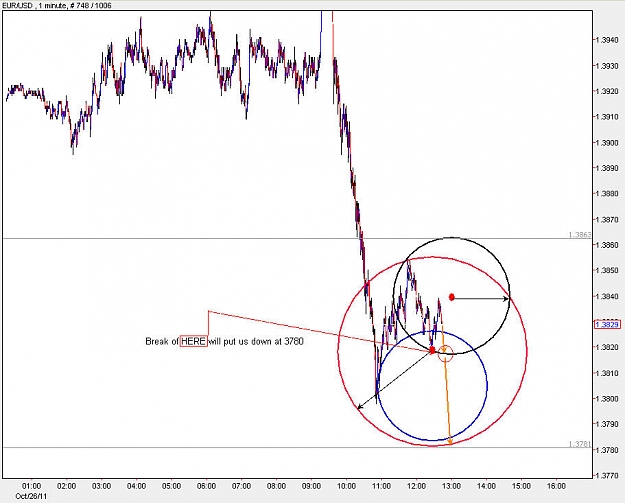
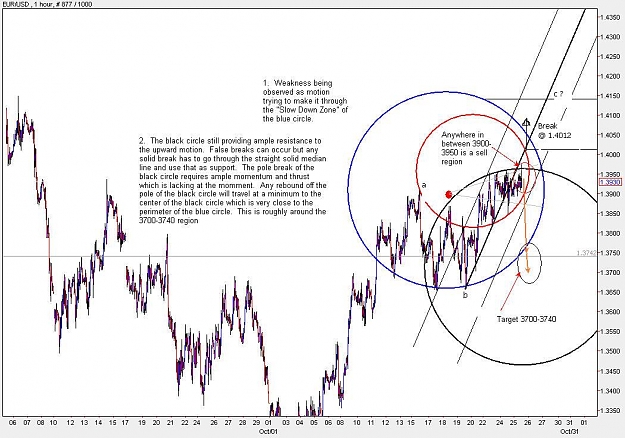
Motion will be rangebound between 3750-3950 for the next 12-24 hours. The last band, namely the blue curve is the most important curve to pay attention to, since it stopped the upward motion of the EUR towards 4000 level. Motion is being caught at the pole of the blue circle, which means its a hard resistance, and we can see a curved top happening. This all points to a reversal in the process of happening. Its the best time to start planting sell positions.
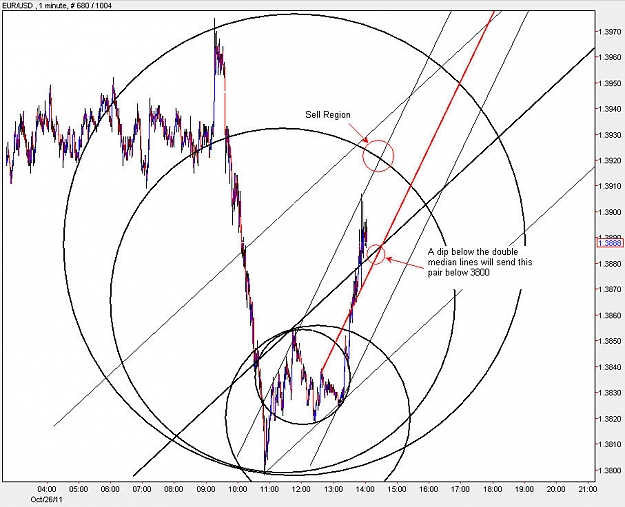
As with all cases where a major turnaround is observed, the percise location and time of the breakout cannot be determined, just a suspected range can be observed.
Usually in all cases a surprise reversal, which when caught too late, is already 150-200 pips on its way happens
For this reason its recommended that you give yourself lots of stoploss at anywhere in between 3850-3950/3980 and continue to spread your lots on a sell basis within this range on any new high that is made.
It is recommended that you do this between the hours of 10:30 AM - 12:00 PM and 2:30 PM to 3:30 PM New York time. It is during these hours that the best positions will become available.
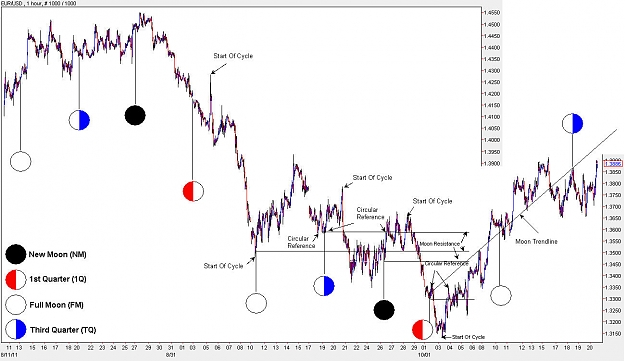
The New Moon is my favorite time to trade. Its on October 26th
There is one additional chart that I have included, that may be quiet a surprise. This chart is the moon cycle for the past 3 months and more often than not, you can see that few days after this one event, the market drops. The New Moon marks a market high. You can check this for the past 6 months as well and let me know whether I was wrong.
My own personal preference is never to buy when close to this cycle. Always Sell. I was reluctant to include this last chart on this thread, but its one of my favorite moments to watch how the market makes a relative high, and its almost, always a guaranteed sell.
As with all cases where a major turnaround is observed, the percise location and time of the breakout cannot be determined, just a suspected range can be observed.
Usually in all cases a surprise reversal, which when caught too late, is already 150-200 pips on its way happens
For this reason its recommended that you give yourself lots of stoploss at anywhere in between 3850-3950/3980 and continue to spread your lots on a sell basis within this range on any new high that is made.
It is recommended that you do this between the hours of 10:30 AM - 12:00 PM and 2:30 PM to 3:30 PM New York time. It is during these hours that the best positions will become available.
The New Moon is my favorite time to trade. Its on October 26th
There is one additional chart that I have included, that may be quiet a surprise. This chart is the moon cycle for the past 3 months and more often than not, you can see that few days after this one event, the market drops. The New Moon marks a market high. You can check this for the past 6 months as well and let me know whether I was wrong.
My own personal preference is never to buy when close to this cycle. Always Sell. I was reluctant to include this last chart on this thread, but its one of my favorite moments to watch how the market makes a relative high, and its almost, always a guaranteed sell.
Attached Image(s) (click to enlarge)