+
if an indicator repaints, you can delete it right away
Ignored
walb99,
Thanks for the comment but I must disagree with you. The moment you throw out one of these indicators is the moment you need to go and find a different system to use. This is because you have just destroyed the system by removing one of its foundations that make the system work.
There are four forces at work here Trend, Emotion, Sentiment, and Extreme each one reinforces the other. The moment you remove one is the moment the system will begin to fail.
Please keep in mind that each builds on the other. The Extreme which is the Cycle Identifier is the Extreme it is also the one that tends to repaint the most just because of that fact. But, it is also an important marker that shows the cycle has reached an extreme point and market forces are at a fluxuation point where they are going to change. (possibly) the exact point the Cycle Identifier canNOT tell when and where but it is just a marker or signal flare.
Please no more talk about just throwing out one indicator. They all have their importance and as I said before...'' alone each indicator is weak but, like a symphony together they make beautiful music''
I hope that explains the importance of using all 4 indicators.
eval.
P.S. NO system is 100% perfect and none ever will be. The market is unpredictable and that is why few make alot of money but this system will atleast provide consistancy and you should be able to make more that you loose.
I believe you are wrong here please read my post#202 to walb99 about throwing out an indicators. That is wrong because you will have destroyed the system by doing so.
Thanks for you reply..I will as you say trade this on a demo for a while and I think this is what all those people who are worried about repainting should do before commenting...
I am sure thats why you wanted to share this so we can try it out and then post some results as a friendly group. We all have a choice try it or leave it..
I think it will be interesting if people try it out this week and post their charts both successful and unsuccessful trades and compare results..
Look forward to this weeks trading
Happy trading guys
Thank You James16, Fijitrader, Mbqb1, ghous, Pinbar and Jarroo. cpfleger
Thanks for you reply..I will as you say trade this on a demo for a while and I think this is what all those people who are worried about repainting should do before commenting...
I am sure thats why you wanted to share this so we can try it out and then post some results as a friendly group. We all have a choice try it or leave it..
I think it will be interesting if people try it out this week and post their charts both successful and unsuccessful trades and compare results..
Look forward to this weeks trading
Happy trading...
Ignored
Seabreeze,
You are CORRECT! It is folly to start trading real dollars on something you have never tried before. DEMO DEMO DEMO dollars. Then practice with the system to determine whether it works for you. In my opinion, that is the BEST course of action to take.
I look forward to seeing your results and comments.
Edit: I should add that these settings seem to be fine for M5 and M15 charts, but a lower Period value would be needed if you were to go to H1 (or larger) charts.
Ignored
realjumper,
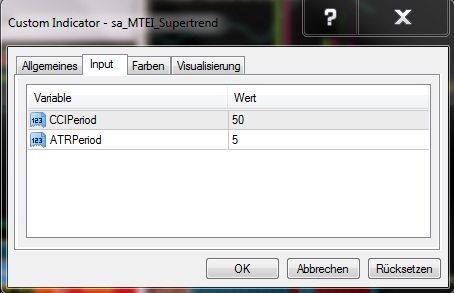
I did some research this weekend on your indicator and it looks interesting. I also did some tweeking on the sa_MTEI_Supertrend indicator and found that I was able to cause a 1 candlestick improvement in the alignments of the indicators by changing the input variable of the CCIperiod from 50 to 35.
It seemed to be a slight improvement. However, this was done while the market was closed. I will play with this over the next week of live trading to see if there is an improvement in entry point identification.
However, changing this to a lower CCIperiod value will cause the indicator to be more sensitive and increases the chance of false signals.
We shall see as I further ''evaluate''.:nerd:
Eval.
WARNING: This is a test and only a TEST. Do so at your own risk....Changing indicator settings has the potential to create system failure so if you are new this is NOT a permanent change. THIS IS ONLY A TEST.
[quote]
I look forward to seeing your results and comments
I look forward to it... I normaly trade off the weekly,daily and 4 hour charts,but will give this ago....
I will not be able to catch most trades as I own and run a retail company but I am lucky to have a multi screen set up in my office and am able to watch the markets most times, but the trades I do catch good or bad I will post up on here.
Thank You James16, Fijitrader, Mbqb1, ghous, Pinbar and Jarroo. cpfleger
May be I need to elaborate a bit further as may be you missed my point being raised:
You state in post #182
"Entry Points Strategy
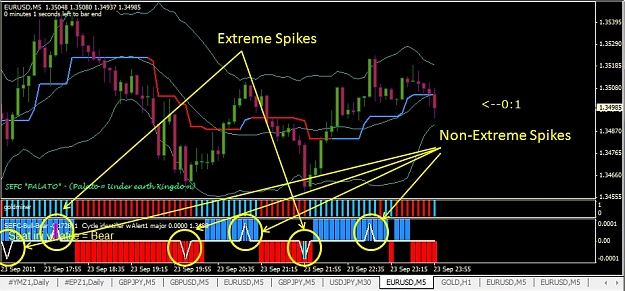
The entry and exit strategy is simple. For placing an order one would wait until you have an extreme spike and the other 3 indicators show the same colour in the direction of the extreme spike. This is shown in the graph as position (A). To exit your order you let the market price action run its path until ,on the closing candlestick, there is an opposite extreme spike (spike with colour) that indicates a top or bottom extreme point has been reached. This is represented in the graph as position (B).
That’s it…. (see graph)"
In the EUR/USD chart example there are 7 Cycle Identifier upward pointing Spikes from the point of entry 'position A', the seventh, position(B), is your exit based upon exiting at the close of the candle when the coloured Extreme spike is created.
However of those remaining 6 upward pointing spikes, a number (for example spike, 3, 4, 5 and 6) would have shown, in real time, red coloured extreme spikes at the close of the candle, BUT a few candle bars later would have repainted as colourless extreme spikes. So in you trade example why is extreme spike number 7 (i.e. position B) the spike you chose to exit on?
Would not spike number 3, 4, 5 or 6 been the first or second etc coloured extreme spike (at the close) to have exited the trade?
Why was the trade not existed at one of those extreme spikes in real-time trading? They would have shown a red coloured extreme spike (at the close). Just that they would have repainted colourless a few bars later and this is now represented in your graph.
I do not dispute the alternative exit methods or their clarifications, just curious why position B was your exit in your example and not any of the other spikes most of which would have been coloured red for exit for a few bars after they initially appeared red! and then repainted colourless!
May be I need to elaborate a bit further as may be you missed my point being raised:
You state in post #182
"Entry Points Strategy
The entry and exit strategy is simple. For placing an order one would wait until you have an extreme spike and the other 3 indicators show the same colour in the direction of the extreme spike. This is shown in the graph as position (A). To exit your order you let the market price action run its path until ,on the closing candlestick, there is an opposite...
Ignored
Bazuka77,
Great follow-up and thanks much for the clarification. There are two types of spikes in the cycle identifier ones that are just spikes (no colour) which are turning points within a price action movement. (similar in Elliott Wave this would be points 2, 3, and 4 in a 5 wave Elliott wave) and then there are the extremes which are the spikes with colour that indicate the end of a movement.
The extreme spikes (spikes with color) are the points I am talking about in the exit strategy. These extreme spikes are where in Strategy 1 you would exit an order. Also, with this indicator the Extreme Spikes have a tendency to repaint because the true extremes in a price action may have one more gasp left or the market has not fully exhausted the price action for that movement. This is the possible downside of the exit strategy 1.
Additionally, these spikes can prove to be potential re-entry points or ''double-down'' moments if you get stopped out of an order. (see post #166 for more clarification.)
I hope that I am understand you correctly and have sucessfully answered your question.
Great follow-up and thanks much for the clarification. There are two types of spikes in the cycle identifier ones that are just spikes (no colour) which are turning points within a price action movement. (similar in Elliott Wave this would be points 2, 3, and 4 in a 5 wave Elliott wave) and then there are the extremes which are the spikes with colour that indicate the end of a movement.
The extreme spikes (spikes with color) are the points I am talking about in the exit strategy. These extreme spikes are where in Strategy 1 you would...
Ignored
What bazzuka77 is trying to say is that all non-extreme spikes were extreme spikes were they first appeared on the chart. With that in mind you would have exited the trade way earlier than the 7th spike.
I look forward to seeing your results and comments
I look forward to it... I normaly trade off the weekly,daily and 4 hour charts,but will give this ago....
I will not be able to catch most trades as I own and run a retail company but I am lucky to have a multi screen set up in my office and am able to watch the markets most times, but the trades I do catch good or bad I will post up on here.
Seabreeze,
The system should work fine in the larger timeframes as well. I think there will be less of a repaint issue but you will trade less in higher timeframes.
As you can see from my chart below, I have far more spikes than you do for the same period. If you remember, early on in the thread someone had the same issue, and I don't think it got resolved. You posted your settings at that time, and my settings match yours, so don't know what the problem is. Any ideas??
And thanks again for the method, I'm looking forward to begin trading with it tomorrow and will try to post some charts.
Thanks Eval!
Attached Image (click to enlarge)
"Be the change that you wish to see in the world." --Gandhi
What bazzuka77 is trying to say is that all non-extreme spikes were extreme spikes were they first appeared on the chart. With that in mind you would have exited the trade way earlier than the 7th spike.
Ignored
mlambole,
Thanks for the feedback. In my experience all the spikes do not show extreme first they just show as spikes. In the graph I showed, spikes in real time and to me they did not show extreme. (just spikes) But keep in mind that the cycle indicator is prone to repaint extreme spikes especially in timeframes below 1hr. That is why I recommend 1 hr timeframes but you will make less trades.
As you can see from my chart below, I have far more spikes than you do for the same period. If you remember, early on in the thread someone had the same issue, and I don't think it got resolved. You posted your settings at that time, and my settings match yours, so don't know what the problem is. Any ideas??
And thanks again for the method, I'm looking forward to begin trading with it tomorrow and will try to post some charts.
You are correct sir! We did have discussions about charts not lining up exactly. (post #164)
It was discovered that it was due to the brokers people were using. With some brokers having delay because of positioning on their perspective exchanges or the possibility of bandwidth issues of the broker.
Someone else indicated it was because some brokers wanted a few miliseconds infront of their client. (in my opinion that is cheating and dishonest)
So, while they may not exactly line up the same principles of this strategy are sound. Also, I think alot of this discrepancy may also be due to lower timeframe (in 5 min. timeframe) and may play into repainting issues.
So, stronger arguement for using higher timeframes.
eval.
P.S. If anyone else has any ideas on the issue.....PLEASE post them here them because I want to know the answer also.
I believe you are wrong here please read my post#202 to walb99 about throwing out an indicators. That is wrong because you will have destroyed the system by doing so.
From what I have read, from this weekend, analysts think the euro has the potential to rebound this week.
My Elliott wave friends believe this could be a turning point for completing a large ABC triangle where the C could end as high as 1.49 -1.50 range. However, I have my doubts because of all the problems with Greece and now French Banks....but who knows..... (only God)
My short-term Elliott count analysis says we are headed down to the 1.32 range before completing a extended 5thwave. But that is just me.
So, hence we begin a new week.......LET's all make some money!!!!!!!!
What bazzuka77 is trying to say is that all non-extreme spikes were extreme spikes were they first appeared on the chart. With that in mind you would have exited the trade way earlier than the 7th spike.
Ignored
Well, the thing is an "extreme" spike can become a "normal" spike after a repaint. What should we do ? Stay or exit directly when we saw a color in the spike ? Or maybe wait the candle to close ?
Well, the thing is an "extreme" spike can become a "normal" spike after a repaint. What should we do ? Stay or exit directly when we saw a color in the spike ? Or maybe wait the candle to close ?
Ignored
lhDT,
Please see post #182 or post #1; I identified three possible exit strategies to choose from or feel free to develop your own. If you do, please share with us the ones that work.
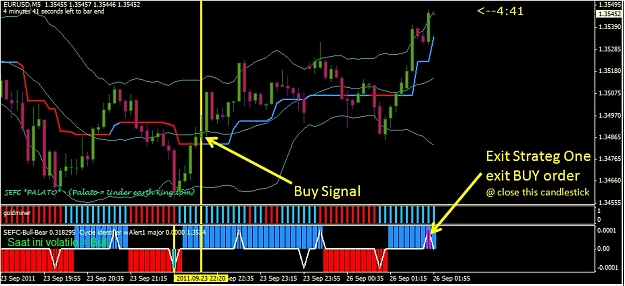
Here is excellent textbook example of entry and exit strategy #1.
I did not take because ,as a personal rule, I never let a trade run past Friday. Out on Friday and back in on Sunday.
Anyway, if you took it here is Exit Strategy 1 closing signal.
Also, with the new extreme toping spike we can now look for the currency pair to move lower and provide us with a SELL entry point. Now is time to pay attention to the other 3 indicators....
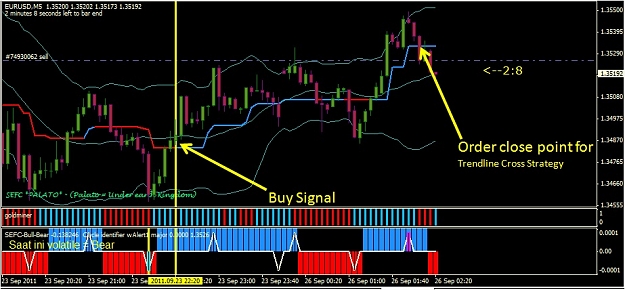
Here is another Exit Strategy that I am calling the ''Trendline Exit Strategy''.
You enter an order as normal per the 4 indicator rule the price action runs and an Extreme Spike is signaled. However, you do not close the order unless the price action crosses the trendline. At the close of a candlestick where the ending price has crossed the trendline indicator you close the order. Almost the same as Exit Strategy 3 but with a twist because you may get a better closing price.