Guess I'm cranking some charts out, guess my violent neighborhood has me on my toes today.
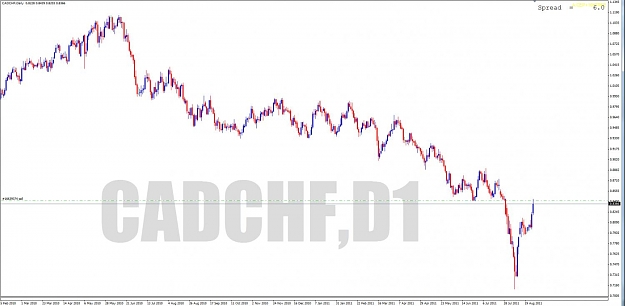
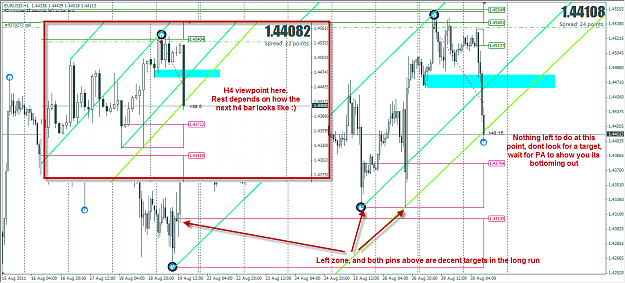
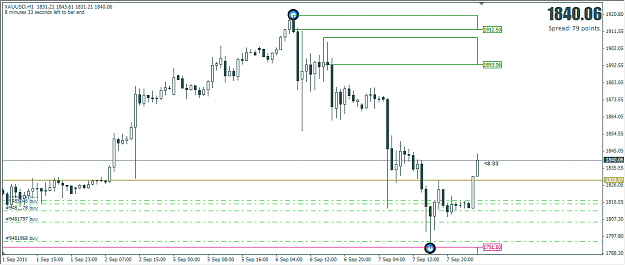
Here is gbp/usd, on the left is H4 and on the right is H1. All I'm trying to show here is climactic volume into demand. You can see the volume surge on the H1 as price plowed into the next (unmarked) H4 demand level.
Here is gbp/usd, on the left is H4 and on the right is H1. All I'm trying to show here is climactic volume into demand. You can see the volume surge on the H1 as price plowed into the next (unmarked) H4 demand level.
Attached Image (click to enlarge)