Seems pretty unusual to me, although possibly right for different reasons. Here's what I mean.
The below MT4 screenshot should be of a Citibank feed, I've marked a red arrow where you're seeing your volume, and I am seeing no significant change. Notice also the large difference in tick scale count.
I don't know enough about Tadawul to say who their liquidity provider is, or, what they are echoing back through their volume data. The volume 'spike' you're seeing at your marked area could well represent actual Tadawul retail customers buying; since it is tick volume we of course don't know in what quantities, but if they are smaller amounts (as tends to be the case with us retail customers), one will see a marked increase, like you are noticing. Also, when the overall volume scale is constantly on the low/lower side, it comes across as a surge and skews things, but IMHO isn't necessarily representative of what the broader market might be doing. (Meaning, other banks, institutions, funds, etc. - notice I don't mention retailers because, I frankly care least about them )
Overall, I would say that a higher tick count or scale in BV is representative of a larger liquidity pool. I doubt Tadawul will actually say who their LP is. Regardless, that volume isn't industry representative, because, there seems to have been no noticeable reaction in PA, or change in bar ranges after that. I have a colleague who trades with them, and there do tend to be differences between our charts, not frequently this dramatic, but, different bars will stand out for high volumes, which then of course drives different interpretations, and different trigger numbers, if one is using them
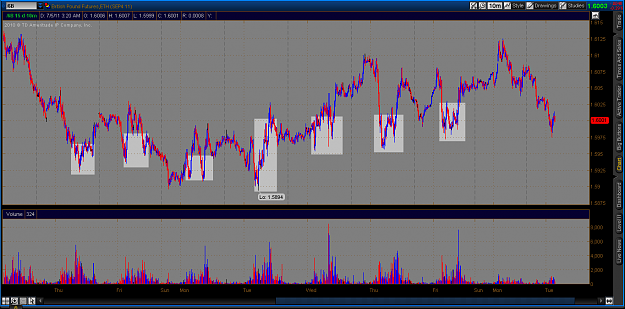
I've also included a swissy futures chart in case it helps. I don't see any discernible change in volume around that time. Futures are of course representing something different, but, I use them together to try and better forecast and see turning points, via stopping volume, and upthrust high volume. Hope that's of some assistance.
(BTW, I wrote this response not realizing that it was apple_sauce seeking confirmation of FXCM volume, lol! I'll let my response stand in case it helps anyone. Two other things come to mind: 1) The FXCM volume doesn't seem right either especially given 2) this all would have been around 2pm-3pm NY time, a normally rather illiquid time and terrible point to enter any types of trades, certainly so when it was July 4th, and it was primarily algos keeping things running) It does look like IBFX has fairly decent relational volume, as does eSignal (as expected), in the chart posted by KinsaleForex.
Seems pretty unusual to me, although possibly right for different reasons. Here's what I mean.
The below MT4 screenshot should be of a Citibank feed, I've marked a red arrow where you're seeing your volume, and I am seeing no significant change. Notice also the large difference in tick scale count.
I don't know enough about Tadawul to say who their liquidity provider is, or, what they are echoing back through their volume data. The volume 'spike' you're seeing at your marked area could well represent actual Tadawul retail customers buying; since...
Ignored
Interesting indeed
This is my TDFX 15min chart on USD/CHF:
Attached Image (click to enlarge)
and this one is from my ECN broker:
Attached Image (click to enlarge)
Both get unusual high volume but TDFX volume is more on the extreme side.
This is my first post. I am very excited about VSA that I decided to finally become a member and post! As I am new to VSA, my understanding is somewhat limited so go easy on my crude analysis.
Per my current understanding of VSA, there are periods of accumulation/distribution. Accumulation happens when the majority of the volume is occurring on down bars at the bottom of a given range and distribution takes place on up-bars towards the top of a given range. In the picture, I have highlighted the areas where the futures volume is heaviest. In my mind, this would be an indication that there is "accumulation" in progress on GBP/USD as the majority of volume is taking place towards "support" areas. I have also noticed that as price reaches the upper boundaries of this current range, that volume dries up which would indicate that the "Smart Money" is not interested quite yet in higher prices and that further accumulation needs to take place. Therefore, once "accumulation" is done, higher prices would be expected on rising volume so as to trap current short sellers in the previous accumulation area for a loss.
Looks like were in a distribution phase on EU. Notice the mushrooming over, and every top is on ND. I don't normally use RSI but it's hard to not notice the massive divergence. The premium trade for today will be a short on the top of the newly formed channel, marked by the Grey area. Also after a massive SO like the one in the middle of the chart you would expect price to resume trending up, we didn't even make it back into the previous channel.
Looks like were in a distribution phase on EU. Notice the mushrooming over, and every top is on ND. I don't normally use RSI but it's hard to not notice the massive divergence. The premium trade for today will be a short on the top of the newly formed channel, marked by the Grey area. Also after a massive SO like the one in the middle of the chart you would expect price to resume trending up, we didn't even make it back into the previous channel.
4280 test first imo. look at dxy futures late last week. we're in for a shakeout on euro before going higher imo.
Ignored
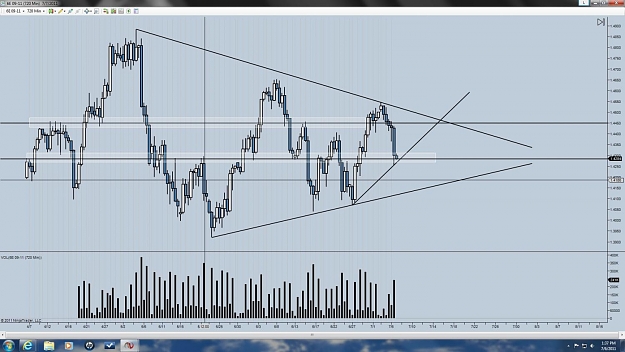
Focusing now on test of 1.4235ish area. I don't think we've seen the bottom yet. One of my reasons for being bearish was the fact that we were testing on low vols that 4460 area throughout all of asia and were holding below it.
Number #1 in PnL and Pips on Dukascopy Trader Contest since 2011
Focusing now on test of 1.4235ish area. I don't think we've seen the bottom yet. One of my reasons for being bearish was the fact that we were testing on low vols that 4460 area throughout all of asia and were holding below it.
Ignored
Everything is done to put everyone biased in the wrong direction. EU has been bought up big time on weakness over past several weeks. Moves today and Weds are nothing more than testing and trap. IMO we're in for 1000 pip pop off the 1.42's over next month.
Number #1 in PnL and Pips on Dukascopy Trader Contest since 2011
Looks like were in a distribution phase on EU. Notice the mushrooming over, and every top is on ND. I don't normally use RSI but it's hard to not notice the massive divergence. The premium trade for today will be a short on the top of the newly formed channel, marked by the Grey area. Also after a massive SO like the one in the middle of the chart you would expect price to resume trending up, we didn't even make it back into the previous channel.
Ignored
Not necessarily a distribution phase. Its temporary weakness for sure, SM just not ready to take eur up yet. There was tons of accumulation going on in June.
Number #1 in PnL and Pips on Dukascopy Trader Contest since 2011
![Click to Enlarge
Name: eurusd h8 [07-07-2011].gif
Size: 39 KB](/attachment/image/736932/thumbnail?d=1365703076)
![Click to Enlarge
Name: eurusd h12 [07-07-2011].gif
Size: 42 KB](/attachment/image/736933/thumbnail?d=1365703076)