this kinda gives some insight into a few things which include concepts if the markets are really random among a few other insightful things..
If your driving.. And the road is going left.. Why would you take a right off the road.. I suppose if the markets are random you might have some insight into going off road since it will randomly go anywhere..
But besides the random concept and just into a traders mind.. Why would you want to take a right anyways.. Sure you can't see beyond your headlights.. But what you can see within your headlights the...
Ignored
Outstanding illustration!!!
"GIVE ME 3 POINTS IN SPACE IN TIME AND WATCH ME CREATE MAGIC."
what if your entire trading just revolved around the unforeseen events.. well if there unforeseen newyear how the hell can we profit from it...
basically a giant breakout system.. or the reverse.. so if you have a breakout set like 500 pips away from the day.. the one day something crazy happens and it rallies up or down you would be in riding it
Ignored
This strategy is actually one one of Taleb's main points. Since price distributions have fatter tails than most market participants allow for, a real statistical edge over those participants could be gained by taking positions in very high gain/low probability events. The "low probabilities" aren't as low as people think, and given enough time they become much more likely.
I seriously believe if one is to start thinking outside the proverbial box one must begin doing 2 things (one was mentioned already):
1) Define and clearly understand what exactly is contained inside the box and its 4 walls. Because, if you dont know what exactly is in the box...how do you know your thinking outside the box?
2) Change ones views and beliefs about the markets. The only way to see things differently is by looking at them from a different angle.
By questioning only then will one be able to approach the market both with adequate knowledge and a new belief set that will allow them to view the markets in a completely different way. Which in turn, allows one to "see" what others dont.
In order to find the right answer you must first ask the right question/s...
Here are some thoughts that maybe others would like to openly discuss/debate/add/laugh/think about:
1) Are markets constantly changing or are they always the same? If you do believe they constantly change, then what exactly constantly changes and on what facts do you base this on?
2) Do the type of charts you use (time, renko,...) affect the way you "perceive/view" the market/s? Do they affect the way you trade them?
3) If you use time bars. Do you think price is doing the exact same thing on each timeframe or does price have its own structure on each timeframe?
4) When we boil things down to its most simplistic terms, all we need to continually bank profits is a movement from a to b (if trading directionally).
So, what type of circumstances/events can provide you (on a consistent basis) with these directional "a to b" movements?
5) Price is constantly in motion, flowing on your screen up and down as orders get triggered. As orders get triggered they create varying degrees (intensity) of movement in the market.
So, has anybody considered "measuring" the intensity of moves that order flow can produce? Is this even worth considering?
6) Some say markets are random, some say they are a mixture between predictable and random. If markets where truly 100% random, do you think it would be possible to consistently make money? And if so, what would allow you to do so?
7) If one can design a system capable of outperforming in a 100% random market, then wouldnt this in itself be capable of outperforming in a predictable environment? Isnt this another way of testing how "robust" a system/approach really is?
8) What is the difference between a trend and momentum? (none of this HH/HL stuff please).
Some will read this and say its a load of BS, maybe others will get some ideas out of this and participate.
Im not yet consistently profitable but im certainly changing the way I think/see the markets.
8) What is the difference between a trend and momentum? (none of this HH/HL stuff please).
Ignored
Trend is a steady or average 45 degrees angle, by definition.
Momentum is spasmodic Gann Fan - like version of one too-simple or too-complex direction.
I like the different versions of Gann Fan -like moves, such as running up so fast that little notches form in a nearly straight line, price struggles to pick direction after an initial run, or the initial move is retraced so many times that price slows and turns the other way.
Trend is a steady or average 45 degrees angle, by definition.
Ignored
How do you take into account the candle width?
These two pictures show the exact same EUR/USD thing, but one has very narrow candles. Notice that in the first image the angle is < 45, in the second is > 45.
Also, how do you take into account the range? If the pair moves between 1.0 and 1.5 in a picture, the angles (for the same portion, lets say 1.40->1.45) will be larger than if the pair moves between 1.4 and 1.5.
These kinds of issues made me work with fixed chart ranges, for example always between 1.0 and 1.5, so there is no auto-rescaling based on the exact range of the current portion that I'm viewing.
These two pictures show the exact same EUR/USD thing, but one has very narrow candles. Notice that in the first image the angle is < 45, in the second is > 45.
Also, how do you take into account the range? If the pair moves between 1.0 and 1.5 in a picture, the angles (for the same portion, lets say 1.40->1.45) will be larger than if the pair moves between 1.4 and 1.5.
These...
Ignored
finally, someone who gets such obvious and simple stuff
a smarter person wouldn't be measuring angles and star signs and cloud patterns and tarot cards. a smarter person would make judgements off the one things that tends to stay roughly standardized... the spread.
Congratulations ScalaFX for coming out of the closet!
|
Membership Revoked
|
Joined Jun 2010
|1,246 Posts
Well I too am glad someone finally noticed the obvious. For me, angles, trend lines, and all that geometrical stuff applied to a chart to predict future price is absolute nonsense. Patterns in the clouds.
But that's just me. You wanna base your trades on that stuff go ahead, nobody cares. Actually the more liquidity you put in the market the better for everybody profiting from dumb money.
I think Graeme's method of trading under "Building an equity millipede' is a good place to start. It simply translate to lose little and win plenty. That's the surer way of winning the game. It can be frustrating but you must be discipline and diligent and you will be surprise at the end results. Its beyond your expectations.
if there is already a thread for an idea then it IS INSIDE THE BOX. if you don't have something creative and new to add then don't waste our time just spewing links to other threads. seriously, come on!
Congratulations ScalaFX for coming out of the closet!
a smarter person would make judgements off the one things that tends to stay roughly standardized... the spread.
Ignored
Now, that's outside the box. I've seen the bid,ask lines used, just ignored it. Can you elaborate? Do you mean you chart and study the bid-ask lines of a non-fixed-spread broke r's feed?
And agreed on fixed-range charts. I've been using them for my charts for a good while, have stated so in the past. Changing the range and width of candles does help adjust one's visual perspective to get new understanding of the chart, though, if not with nonfixed range.
On patterns: They're only as good as they functionally align with themselves and other chart areas through drawing devices,
and thus they tend to need more chart history,
are temporary,
and only resemble a standardized shape superficially as an optional guideline.
For me, I try and define any pattern with much smaller, 'sub-' patterns that one traces through a chart area to add definition to it, but struggle to do so.
Often, it is easier to simply interpret the candles directly
or to put a traditional pattern type on the chart and define traces within it that undermine the definition and that turn price from it.
Now, that's outside the box. I've seen the bid,ask lines used, just ignored it. Can you elaborate? Do you mean you chart and study the bid-ask lines of a non-fixed-spread broke r's feed?
Ignored
i thought most people were like me... i keep finding-out that this is far from the truth at almost all times.
without looking into your previous posts it's becoming clear to me that you are a high timeframe trader, therefore, the bid/ask spread probably appears as some annoying line or 2 somewhere on your chart that is mostly to be ignored and has no bearing on anything.
for anyone studying tick / 1min / 5min charts the spread is everything. if you can't overcome the spread you can't do anything. as the spread tends to stay relatively similar (apart from news events) then this becomes an easy measure of everything else around it. momentum, a trends price distance, volatility over a number of bars, all is very clear and tells a straightforward story when you measure all of them against the spread.
it's like measuring anything, anywhere, at any time. you don't pick up a random stick off the ground and go "ok this is 3 sticks high, and 5 and a quarter sticks long". you get a standardized ruler or measuring tape and make standardized measurements, and everything everywhere then has an anchored and relative measurement to all other things.
why anyone would 'measure' anything displayed on screen using real world references is beyond me. you can set your charts to to be fixed distances etc in the options, but then all it takes is something as simple as a resolution change or monitor change and now everything is again displayed at a different ratio than before.
in summary, you are either going to eyeball everything off of the prices displayed on the price scale which can be difficult at best and pointless at worst, or you can just judge everything based from the size of the spread since it doesn't tend to change much. "this bar is half the spread. this bar is 3 x spread. these bars here have long wicks and short bodies and are roughly 2 x spread within a range of 5 x spread so therefore something just happened to kick in volatility but price didn't move much either way, so either it was liquidity going in or liquidity being removed that spooked the horse"... etc.
this isn't new to people, right?
edit : forgot to add... for higher timeframes it's just the same as having horizontal lines at round numbers and vertically marking-off the hourly starts / daily starts / whatever. somewhere along the way you have to ground yourself with some form of actual price distance reference. fast timeframes can simply use the spread, else just use something else embedded within the market like round numbers and hourly clock rollover. you certainly don't get a ruler out and start making marking on your pc screen.
Congratulations ScalaFX for coming out of the closet!
A trend is nothing more than a movement that persists in a given direction.
If we start at 10 and price has gone to 30, that in itself is a movement.
A trend. A fad. The here and now. The "latest thing".
One doesnt need lines (nor charts even) to "see" this imho.
Momentum is speed. The rate at which the trend is moving at.
This "speed" is relative to the average speed (momentum) preceding it.
As in..."Is the momentum of this so called trend increasing or decreasing?"
However, is momentum the same as volatility? What do you think?
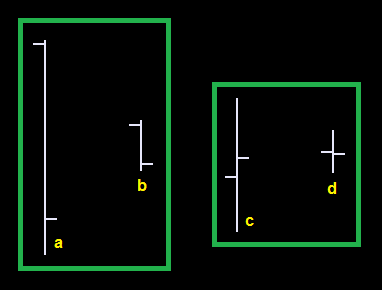
Also, ive attached a picture and some questions if you guys are interested in discussing (or not):
1) What is the difference between a, b, c, d?
2) How would you define these bars as? a trend, a range, dojis...something else?
3) If the only information you had was one bar, would you consider it tradeable or non-tradeable?
4) Why do you think its tradeable and why not tradeable?
5) Could you build a system out of this? (Yes - Why - How) or (No - Why not)
too many questions... but re volatility and momentum.
momentum is to volatility what m1 is to h1. you have moves of differing momentum within a range of time which gives an overall result of volatility within that time.
and i don't agree with your momentum = speed. you can have bars that jump up 10 pips then back down 10 pips. there was plenty of 'speed' within both bars, but net momentum of nothing. it might just be my framing of things, but momentum for me is persistence of movement over time. if it doesn't really get anywhere then over that time you would have lots of... wait for it.... volatility within that time. you can have volatility as well as momentum. massive retraces that then get nullified by big pushes back into the trend is momentum that also has volatility.
but, i'm just talking out of my butt so whatever.
Congratulations ScalaFX for coming out of the closet!
momentum for me is persistence of movement over time. if it doesn't really get anywhere then over that time you would have lots of... wait for it.... volatility within that time.
questions lead to thought which is great, but not all thought leads to answers which is not so great. anyway, don't let me stop you from stoking the fires in this thread just because i didn't answer how you wanted.
Congratulations ScalaFX for coming out of the closet!
it's like measuring anything, anywhere, at any time. you don't pick up a random stick off the ground and go "ok this is 3 sticks high, and 5 and a quarter sticks long". you get a standardized ruler or measuring tape and make standardized measurements, and everything everywhere then has an anchored and relative measurement to all other things.
Ignored
This is why I work with log-prices - instead of taking 1.4123 as the price of EUR/USD, I compute log(1.4123)=0.3452 and continue with that.
But they still work with real prices, and only change the scale. Instead of changing the scale, I keep it linear, but apply the logarithm to the price instead, like a lot of quants do. This has a number of advantages.
For example, a 100 pips increase of EUR/USD from 1.1 to 1.2 is not the same as 100 pips from 1.4 to 1.5 - in the first case there is a change of 9%, in the second of only 7%. With log prices you can't fall into this trap:
The first 100 pip change is clearly larger with log prices.
BTW, on the M1 timeframes that you use there is another very interesting analysis that you can do, besides watching the spread - measuring the time interval between individual ticks coming in, using Autoregressive Conditional Duration models.
questions lead to thought which is great, but not all thought leads to answers which is not so great. anyway, don't let me stop you from stoking the fires in this thread just because i didn't answer how you wanted.
Ignored
Nah you didnt touch a nerve. FF has to be taken with a pinch of salt.
But I do find it funny in a thread where there are so called "out of the box" ideas and "thoughts" being discussed that it isnt an open minded discussion, but more of a self opinionated thread.
Any thought provoking questions you'd like to share with others?
But they still work with real prices, and only change the scale. Instead of changing the scale, I keep it linear, but apply the logarithm to the price instead, like a lot of quants do. This has a number of advantages.
For example,...
Ignored
tbh around the time of learning about matrix math and log and natural log was about the time my brain stopped working in high school. i do partially grasp the concept of log after a quick refresher now, though.
the granularity of price moves when scalping is such that it's a non-consideration anyway. it really only matters when switching from one currency pair to another as the difference can be massive in calculating position sizes.
my spiel was induced from ha-pattern talking about 45 degree angles etc. this is still going to be a massive blindfold when using log adjusted prices due to the x scaling still being an influence on the x/y ratio/tangent.
and that ACD link just made a part of my brain give up and die. some of you guys are rocket scientists amongst us playing with playdough and boogers.
Congratulations ScalaFX for coming out of the closet!