|
Joined Apr 2010
|
Status: Don't mind me, I'm just picky.
|764 Posts
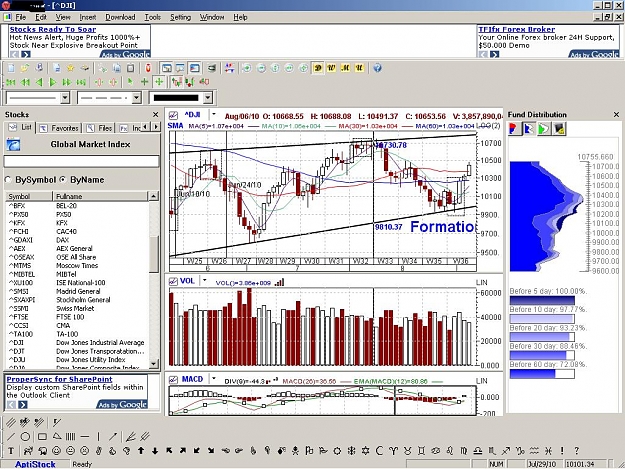
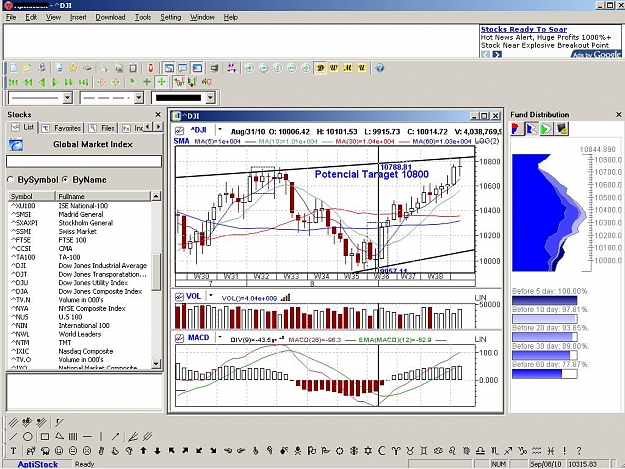
The chart shows a head and shoulders.
There was a pin bar on the daily when price started to fall.
There has been the longest consecutive daily fall for at least 6 months.
The chart is in oversold territory right now - so a lift in price is likely, other indices have done so.
The indices are tending to follow each other and oil follows as well and Liberty's stores - look at the charts.
The Dow has further to fall. What is keeping it up anyway?
I did notice the pin bar on the daily chart, although daily trend following studies suggest a follow through of downside movement on the break down.
What is keeping it up? Indecision as far as I can tell... The majority of traders are still mixed as to the direction the market will take. So, we get a trading range as we can see on the chart I posted... just so happens that a few moving averages are right there in that area and price looks to have used them as support levels a few times before breaking down through them. There is just one left there, the 200 SMA. Looks like we are headed down to meet it.
|
Joined Apr 2010
|
Status: Don't mind me, I'm just picky.
|764 Posts
Analogies have been drawn with the 1929 crash (2009) and the subsequent slide down during the Great Depression.
The charts are looking very similar and the credit crises surrounding the 1929/2009 crashes and then the defaults on sovereign debt in Europe in 1930 with the Euro crises.
Yes, you are right! That is not the 200 SMA! My mistake... that is in fact the 100 SMA. The 200 SMA is the purple one at the very top, right at the 61.8% fib level where price rejected off. Yes, on the weekly chart the 200 SMA was breached way back in June of 2008 at the beginning of the last crash.
Yes the similarities of the market conditions between the Great Depression and Now are frightening! Keep in mind as well, that at the time of the 1929 crash, people didn't have much debt at all... there wasn't such a thing as a home equity loan... and the consumer wasn't a trillion dollars in debt*.
I added a 100 SMA to the chart it matches yours now.
This isn't an average I have used but it creates a near term shorting target.
I don't imagine the Dow will collapse to 1600 but I can see much lower coming.
There is talk of reducing the budget overspend. The Fed seems only to want to hand the nameless banks cheap credit.
It has all just got to unravel - it is "defying the laws of gravity"**
The Fed appears very opposed to deflation and piling fiat currency into the system can only lead to inflation. It is by definition inflation.
There are $1 trillion in the system. $100 buys the groceries. More money is printed which nothing more to back it. There is $2 trillion in the system. Common sense dictates you will need $200 to buy the groceries. The value of the groceries is the same but the value of the money is diluted to a half its previous value.
I guess if you value a company in dollars its stock price will rise, but if the currency becomes worthless and the company profits collapse as the system implodes on itself then the index will fall. We have probably been going through the phase where the index rises simply because the value of what it is measured in $$ is falling. Not falling against other fiat currencies which are going down the tubes as well, but falling against gold which keeps its real value.
I am extremely bearish on the Dow,
I am opening a CFD account with IG markets (i am australian) just to short the dow above 10,000 hopefully, with a stop loss at 11,200.
There are so many alining Head and Shoulders' patterns, in addition to the 60% fib retracement (11,200 - 6626 -7,466) AND if you overlay that to the 1929-1930 charts, it is almost identical.
Combine this with the vast move towards bonds, the revision of US GDP figures, and the fact that the fed may have to implement further stimulus (deffer the crash till later)
and it doesn't take a nut-job to see that a bearish position is appropriate.
also - on a monthly/yearly Dow Jones graph, there is a spooky large Head and Shoulders pattern which projects below zero.
So, CFD's may just be more safe than the stocks they emulate...
|
Joined May 2008
|
Status: Trenfollowing
|436 Posts
dow already made a new low after shooting during friday's trading. I am short just below 10000. Daily downtrend should be running for a while is my guess now ... probable new 5 wave sequence unfolding on the 4h chart.
The Essentials of Trading: Emotions, Risk Mgt, Price.
|
Joined May 2008
|
Status: Trenfollowing
|436 Posts
yes it shot up quite a bit. Just closed a long that ran from end of last week til midday today. We'll see where it goes now for its correction .. one day there'll be a new trend on the daily
The Essentials of Trading: Emotions, Risk Mgt, Price.