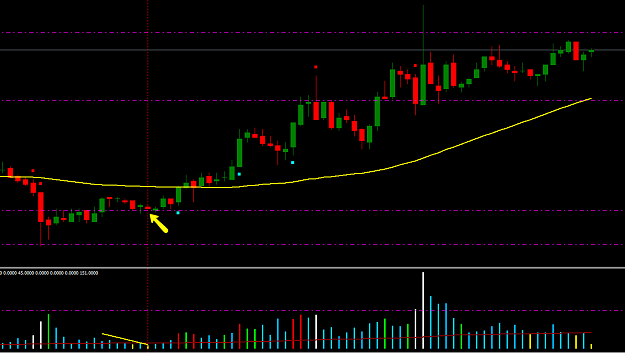
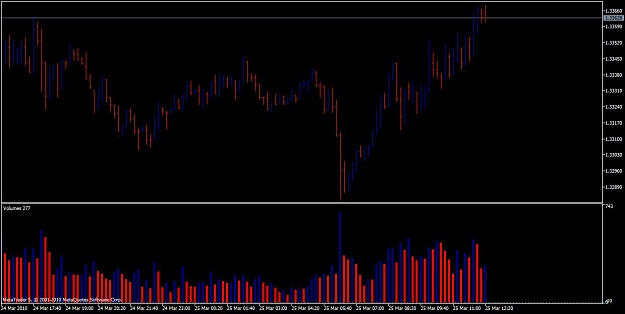
Took the same trade. Nice example of a low vol test.
Entered at the close of the test bar (blue arrow) and took profit at the trend line (yellow arrow) which had a convergence with the 50sma. The move up was on decreasing volume so didnt have much confidence in it breaking through. Closed the rest of it when the second green/bullish bar failed to break through.
C
Ignored
LOL, I took my profits there too - and I've been in and out of another HL trade since....I'm still thinking that there's accumulation going on, but the dollar strength is preventing any real rally.....TWT
Joined Aug 2008
|
Status: *Sic Parvis Magna*
|838 Posts
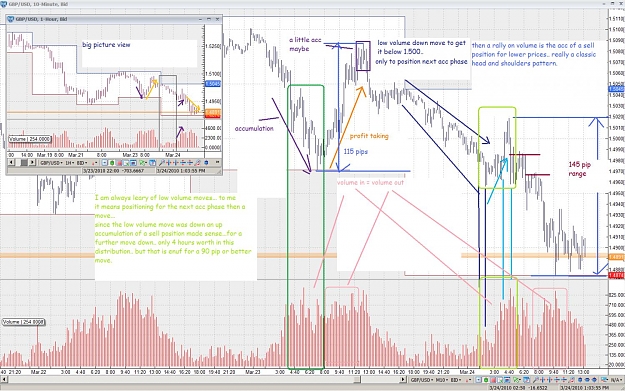
CHART
Attached Image (click to enlarge)
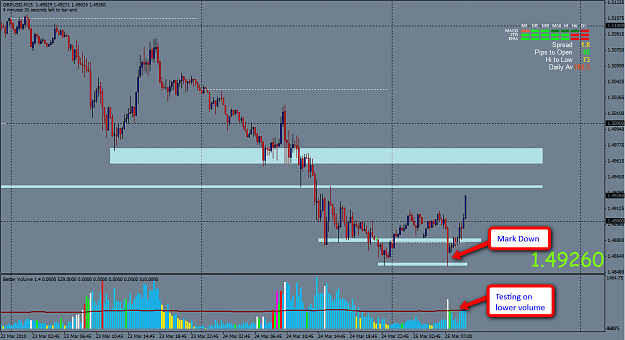
Successful test on lower volume after mark down by the professionals.
What a great time to mark it down. Traders will try to price in the retails sales which is expected to be better than previous (Market sentiment on news which usually happens before the news).
Secondly, we have some sort of regular MACD bullish divergence supporting this move.
Just to show you how smart these guys are. Smart Money indeed.
Nice trade for me.
P.S: Bears are still up there around the 1.5 zone IMHO.
Successful test on lower volume after mark down by the professionals.
What a great time to mark it down. Traders will try to price in the retails sales which is expected to be better than previous (Market sentiment on news which usually happens before the news).
Secondly, we have some sort of regular MACD bullish divergence supporting this move.
Just to show you how smart these guys are. Smart Money indeed.
Nice trade for me.
P.S: Bears are still up there around the 1.5 zone IMHO....
Ignored
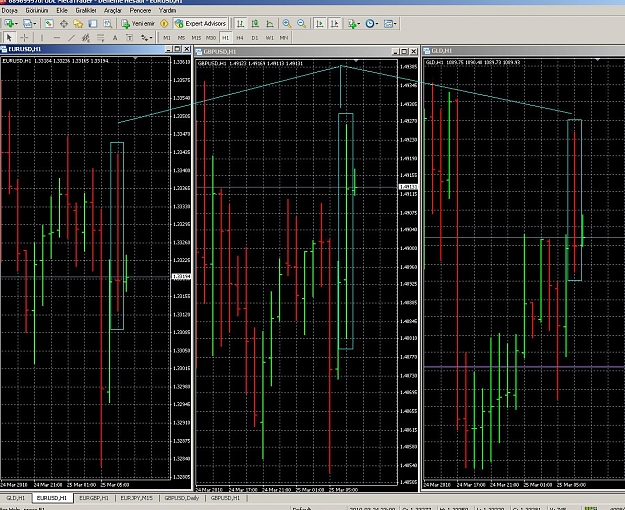
Whilst I agree with the fake-out move by the pros to buy at a low price - and I'm also looking for a "buy the rumour, sell the news" move, this is what I saw and posted elsewhere.....high volume candles on 5m & 15m showing hidden buying
Just over an hour ago there was a retest of the overnight lows - actually a HL by a pip! - the low candle had a long downside wick and was followed by a spinning top/ doji. Both had high volume, which I view as buying......I'm long after the HL ~the 4875 level....
Ignored
Nice one .. I'm always happy to see someone caught a trade with me. Now I dumped and got short from 1.4975 .. SL @ 1.5010 TP @ 1.45 based on my daily chart projection.
VSA side to this. Good news (GBP Retail sales but no news in good news), so it looks like the "herd" is buying. More up bars, on low volume = no demand. Hmm.. Let's see.
Successful test on lower volume after mark down by the professionals.
What a great time to mark it down. Traders will try to price in the retails sales which is expected to be better than previous (Market sentiment on news which usually happens before the news).
Secondly, we have some sort of regular MACD bullish divergence supporting this move.
Just to show you how smart these guys are. Smart Money indeed.
Nice trade for me.
P.S: Bears are still up there around the 1.5 zone IMHO.
Ignored
Please tell me if I understand correctly: the way to play this setup would be to go long somewhere on the 3rd or the 4th bar after the high spread markdown candle, at a price level of around 1.4880?
Or would you place a stop buy a bit higher for more confirmation at that moment?
Please tell me if I understand correctly: the way to play this setup would be to go long somewhere on the 3rd or the 4th bar after the high spread markdown candle, at a price level of around 1.4880?
Or would you place a stop buy a bit higher for more confirmation at that moment?
Ignored
The real way to play it is the way Islander entered which I consider a more conservative entry. I assume he entered around 1.4875 (near the daily open) after the close of the 4th bar (which was actually a down bar) with very low volume telling us it was okay to trust the up-move.
For me, I got in on the close of the 2nd up-bar. But this is an aggressive way I always prefer because I love small stops and perhaps I just felt it was a good mark down.
Ignored
I got in at 1.4875 at after the close of the NS bar(Yellow Arrow). Wasnt up early enough for the spike down.
Reasons:
-Strength/Buying in the background
-Decreasing Volume on the move back onto support
-Support
-NS
@ copi88 & wh1zzo.....great that we're on the same page and banking good pips....
I too was late into my first trade as I only start ~30 mins before FO, and as I'm trading the 1 min swings, I had 3 long trades with my last exit in the news spike - I think the FF calendar had the wrong time!
I took a quick short and banked more pips at the 950 level as I was waiting for my MAs to roll over - they did after the last 5m LH at 11:25 gmt, so I sold again....now we have typically low vols into the main NY open..