USD / CAD,
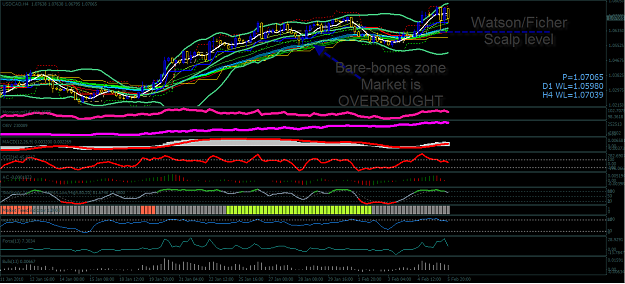
In H4 chart I saw was still in downtrends, I try to look into the H1 chart.
My position at 1.0250 is close by TS, and hit the limit again at 1.0250 and buy it again fortunately profit (after a few days does not open metatrader), the movement hoped to reach a minimum of 1.0295 before reaching 1.0318 (as graph no.1).
Given the resistance 1.0295 and 1.0318 strong enough, the movement could have stayed in support 1.0267 and 1.0295 resistance (such as graph No. 2).
It could also happen that such motion graphics no.3,
back to the hallway past the bearish 1.0267 to 1.0223 support.
I place a sell limit at 1.0318, and wait for buy limit at 1.0223 if 1.0250 is not strong enough to resist bearish possible.
[IMG]http://i894.photobucket.com/albums/a...adh1190110.jpg[/IMG]