(On MT4 - IBFX broker) Can someone please explain why the same trendline appears in completely different location relative to price on different time-frames? Anyone else experience this?
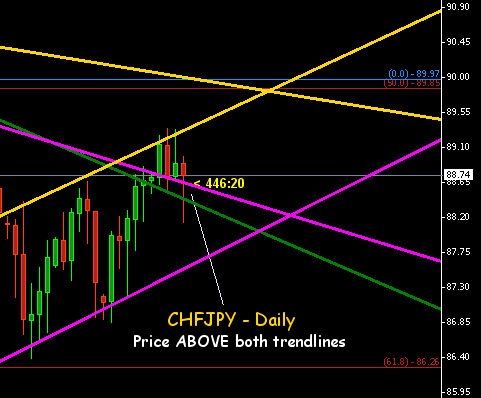
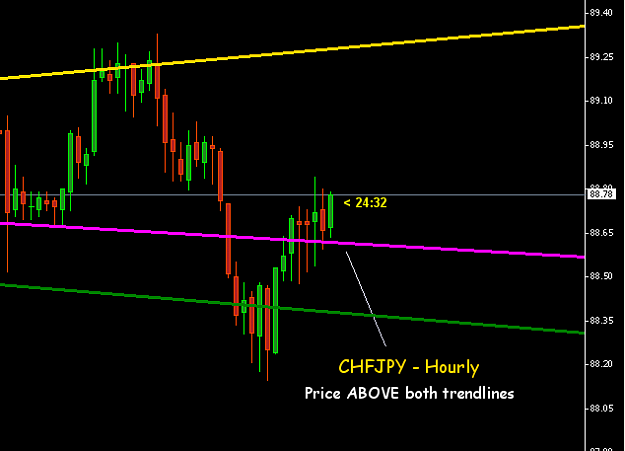
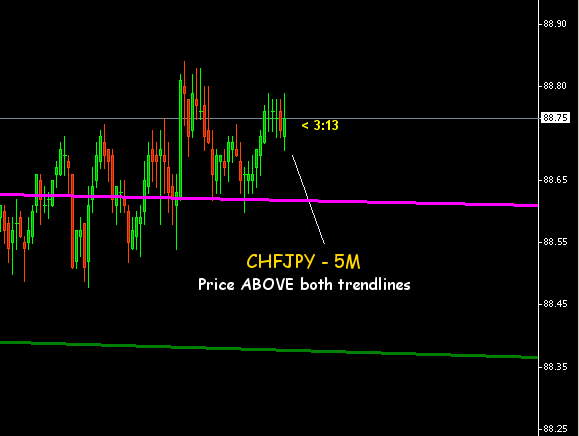
On attached EurUsd - "Daily" chart, my entry was on the pull-back to the green trendline... going short. If you switch to the H1 chart (looking to better time the entry), the entry short appears up in the air and would be a horrible entry, with the trendline coming up as support. So... Which time-frame do I trust? Also... 5M, for example, is different yet. This happens on all charts.
I am definitelly not a novice trader nor at using MT4... but this started about a month ago with all the other garbage rules.
Thank you for any input you offer
Attached Image
Attached Image (click to enlarge)