Hi all
I have an idea for an indicator if anyones looking for a small challenge
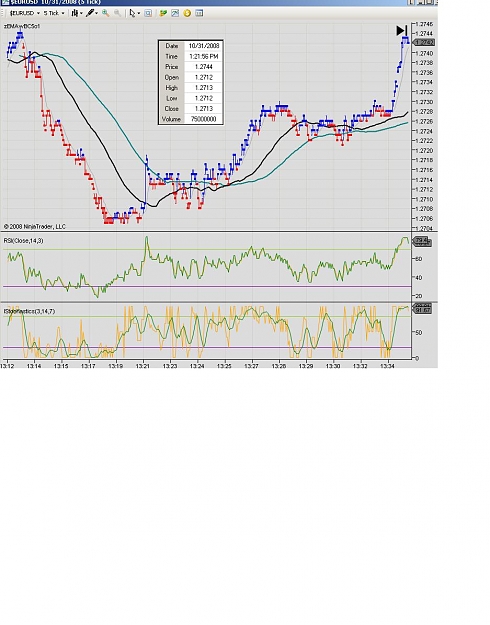
Basically my idea is a tick Stochastic indicator using the same formulas as a normal stochastic but instead having the ability to measur groups of ticks...
For example setting the tick stoch to 14,3,3 might "paint" each time 60 ticks have happened and measures the past 14 groups of 60 ticks...
So exactly the same as a normal stoch but instead of using 5m 15m 30m h1 closes, it uses a certain ammount of ticks -
Hopefully it can be made so that you can adjust how many ticks you want to "measure" before it "paints". Much like how you would put a stochastic on different timeframes
Also would be good to only show the last closed value and not the live "current period" otherwise the line will be flashing up and down very confusingly (is that a word?)
Make sense?
Any questions feel free...
Cheers
I have an idea for an indicator if anyones looking for a small challenge
Basically my idea is a tick Stochastic indicator using the same formulas as a normal stochastic but instead having the ability to measur groups of ticks...
For example setting the tick stoch to 14,3,3 might "paint" each time 60 ticks have happened and measures the past 14 groups of 60 ticks...
So exactly the same as a normal stoch but instead of using 5m 15m 30m h1 closes, it uses a certain ammount of ticks -
Hopefully it can be made so that you can adjust how many ticks you want to "measure" before it "paints". Much like how you would put a stochastic on different timeframes
Also would be good to only show the last closed value and not the live "current period" otherwise the line will be flashing up and down very confusingly (is that a word?)
Make sense?
Any questions feel free...
Cheers
Time hides Nothing