Indicator Value
------------------------
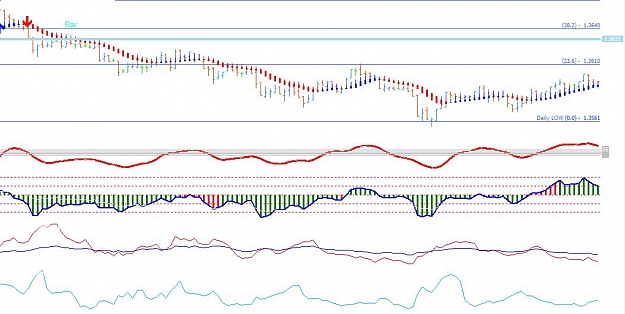
Chaikin's Volatility indicator is calculated by taking an exponential moving average of the difference between the high and low prices over the given period of time (MA Period). A percent change (or rate-of-change) is then taken for the moving average over the given period (ROC Period). The percent rate-of-change value is traditionally multiplied by 100 for easier graphing.
Since Chaikin's Volatility uses exponential moving averages, it will have values at the beginning of the data series. However, you may want to ignore values prior to a sum of the two periods has completed.
Usage
-----------
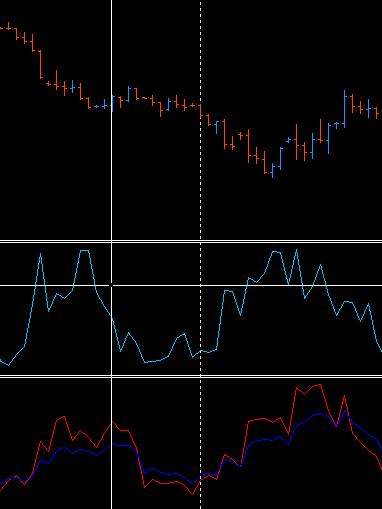
Chaikin's Volatility indicator measures the volatility of a security. High values indicate that prices are changing a large amount during the day. Low values indicate that prices are staying relatively constant. Note that both trending and level prices can have high or low volatility.
High volatility levels can sometimes be used to time trend reversals, such as market tops and bottoms. Low volatility levels can sometimes be used to time the beginning of new upward price trends following periods of consolidation.
------------------------
Chaikin's Volatility indicator is calculated by taking an exponential moving average of the difference between the high and low prices over the given period of time (MA Period). A percent change (or rate-of-change) is then taken for the moving average over the given period (ROC Period). The percent rate-of-change value is traditionally multiplied by 100 for easier graphing.
Since Chaikin's Volatility uses exponential moving averages, it will have values at the beginning of the data series. However, you may want to ignore values prior to a sum of the two periods has completed.
Usage
-----------
Chaikin's Volatility indicator measures the volatility of a security. High values indicate that prices are changing a large amount during the day. Low values indicate that prices are staying relatively constant. Note that both trending and level prices can have high or low volatility.
High volatility levels can sometimes be used to time trend reversals, such as market tops and bottoms. Low volatility levels can sometimes be used to time the beginning of new upward price trends following periods of consolidation.