LOL mark, you mean you are crying all the way to the bank on trades like this.
Ignored
lol.. no, what I meant is being stopped out 6-7 times in a row for 20-30ps before you get one 200ps homer. That's the price of touch trading. DB sure helps a lot if you spot them at the right time....
Rac, what is difficult to me is understand the price action used in that trade. Price never came back to 9817 (to put a buy limit on the second touch) . I can't see any price action on 15m, 1h, 4h. Maybe it was the close of the 4h bar but it was a DBHLC.
sorry if this is a stupid question, but i can't see the price action.
thanks in advance.
Ignored
because there is no pa.
I use aggressive trading technique from time to time (to complement PA to come) once I made up my mind re: trade direction. I called it R-1hr db in the PF. It is however beyond the scope of this thread and not suitable for everyone, therefore you'd have to excuse me for not going into details here.
Hey guys,
This is my first post. Excellent site and I just signed up to James16 group. I see a BEOB on the USD/CHF 4 Hr at a PPZ. Am I correct to say this is heading down to 1.0220 area?
Good morning. I am studying price action and I am just a beginner. I would like to start by thanking you all for the excellent posts and analyses I have read.
pipsja's and giraia's posts have raised a question. Could somebody take a stab at explaining how price action on the H4 chart can be traded off bars/candles like these with different data feed times?
Attached Image (click to enlarge)
Attached Image (click to enlarge)
I would surmise that similar candle formations could occur on the daily or weekly. Is price action trading much more difficult than it looks?
Good morning. I am studying price action and I am just a beginner. I would like to start by thanking you all for the excellent posts and analyses I have read.
pipsja's and giraia's posts have raised a question. Could somebody take a stab at explaining how price action on the H4 chart can be traded off bars/candles like these with different data feed times?
I would surmise that similar candle formations could occur on the daily or weekly. Is price action trading much more difficult than it looks?
Ignored
That's an awesome example Smikester.
Anyway, it's only a problem if you get upset about missing every decent move in the market. ....Really, if you think about it.
There are so many opportunities that you do catch to worry about it. Enough to make you consistent money anyway.
If you want to watch two different feeds though , do it. I wouldn't recommend the stress. Depends how busy you want to keep yourself.
Quote:
Originally Posted by smikesterhttp://forexfactory.com/images/buttons/viewpost.gif Good morning. I am studying price action and I am just a beginner. I would like to start by thanking you all for the excellent posts and analyses I have read.
pipsja's and giraia's posts have raised a question. Could somebody take a stab at explaining how price action on the H4 chart can be traded off bars/candles like these with different data feed times?
I would surmise that similar candle formations could occur on the daily or weekly. Is price action trading much more difficult than it looks?
That's an awesome example Smikester.
Anyway, it's only a problem if you get upset about missing every decent move in the market. ....Really, if you think about it.
There are so many opportunities that you do catch to worry about it. Enough to make you consistent money anyway.
If you want to watch two different feeds though , do it. I wouldn't recommend the stress. Depends how busy you want to keep yourself.
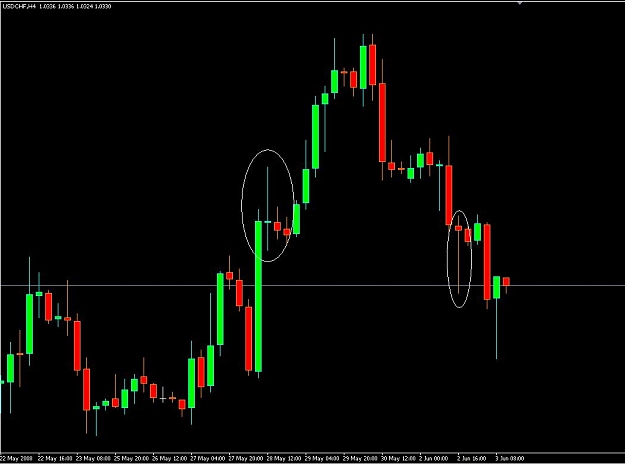
To me this is a good example of some failed trades. That SECOND PB looked like an A trade, and even came up, broke the high by 2 pips, before falling down hard. A conservative play where one places a limit buy above the PB high and a stop below the low would have just literally bought a high and sold a low. At least with the FIRST PB the nose was not broken, but still...
Any insight as to legitimate reasons to stay out of either of those would be great, or are these just "one of those trades"...
Attached Image (click to enlarge)
All I ask for is a chance to prove that money cannot make me happy.
Thanks raczekfx, But my 150 wasn't touching the bar it was bit higher I am using STS Finance feed and also can you expand a bit on Confluence (other than 150 in your case). Thanks for all you help to newbies .
because there is no pa.
I use aggressive trading technique from time to time (to complement PA to come) once I made up my mind re: trade direction. I called it R-1hr db in the PF. It is however beyond the scope of this thread and not suitable for everyone, therefore you'd have to excuse me for not going into details here.
Ignored
Thanks Rac,
Hopefully I can join PF this year, still saving money for that.
To me this is a good example of some failed trades. That SECOND PB looked like an A trade, and even came up, broke the high by 2 pips, before falling down hard. A conservative play where one places a limit buy above the PB high and a stop below the low would have just literally bought a high and sold a low. At least with the FIRST PB the nose was not broken, but still...
Any insight as to legitimate reasons to stay out of either of those would be great, or are these just "one of those trades"...
Ignored
Hey
If you look at the next bar after the pinbar, neither broke the pinbar low(in first case) and high in second case. A good deal of us(if not most) cancel our orders if the next bar does not trigger (the low or high). A pinbar is not valid unless it does break the low/high.
If you look at the next bar after the pinbar, neither broke the pinbar low(in first case) and high in second case. A good deal of us(if not most) cancel our orders if the next bar does not trigger (the low or high). A pinbar is not valid unless it does break the low/high.
I personally do at least
Take care
Mike
Ignored
but if it form another price action, like a IB, don't you trade it?