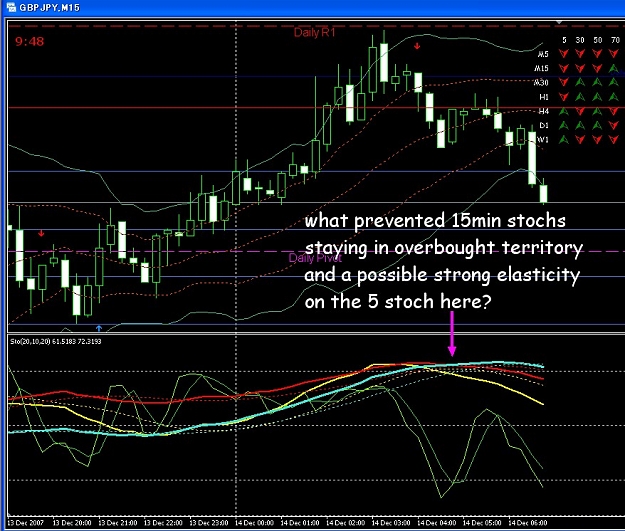
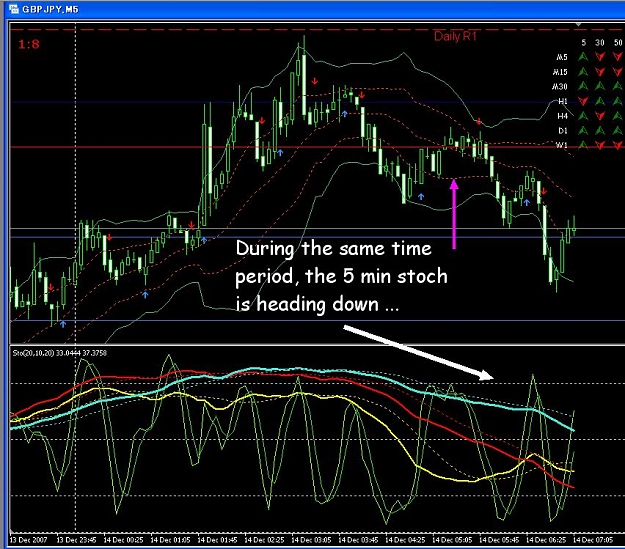
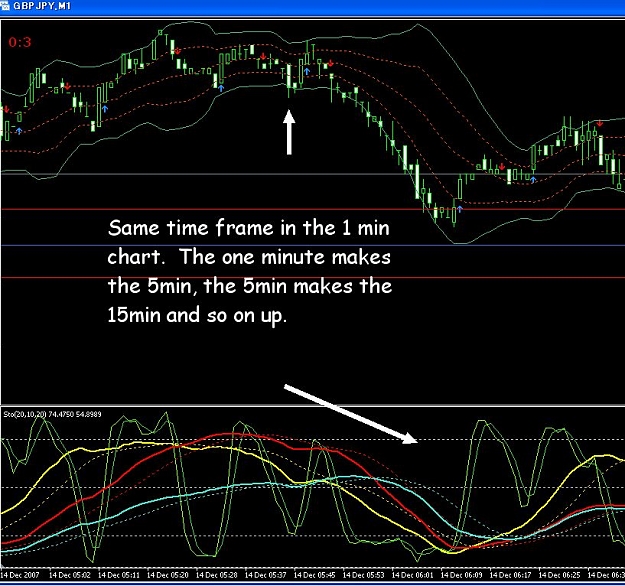
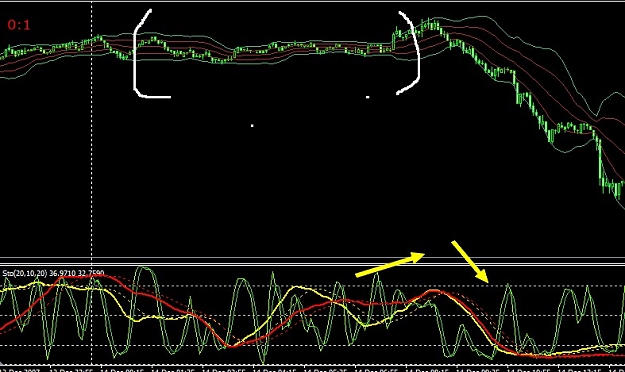
Thank you, guys! The pics I am attaching show the entry after we wait a bit until 5 stoch (now 4) curves down. The 60 mins chart shows that 50 and 20 signal lines crossed and look down; we should wait again until 5 stoch on a 60 mins chart goes south. would it be a valid entry?
Attached Image(s) (click to enlarge)