Hi ALL,
@ Green_David,
I do remember that you did posted a chart for my analysis,
I have not replied your post because you posted a daily chart,
And based on the chart , that market has moved into a range congestion.
Within that congestion time window
is where you will be hinted on the new possibilities that can develop.
What I want to tell you is that instead of trying to impose analysis on the chart,
one viewing of it already can tell you what to expect of the possibilities.
It is what it continues to form as time progresses that is more important.
Resistance and support levels are never absolute.It changes as time progresses.
Your trade positions must change as the chart progresses and a continued analytics be done.
DO NOT try to read it once and have a set mind of the possibilities of what to expect.
The analysis is an on going process and every new bar added will cause new developments.
Never read the patterns that form on the chart, rather recognise it when it forms,
and follow it with a trade position.
Chart patterns can mutate as time advances
and a fixed perspective to the pattern that has formed is dangerous
as it palalyses your ability to change when the dance changes.
Althought it is foundational that you should be able to read the pattern formations,
you should not draw those lines on to your chart.
They can form optical illusions to your mind and
impair your ability of new developments that is coming onstream in the charts.
Follow the development as I explain Zorans chart errs to him.
@ Zoran,
Regarding your posted chart.
Read what I have explained to David. further,
refer to your chart as I highlight the dangers of,
your drawing lines and patterns on your chart.
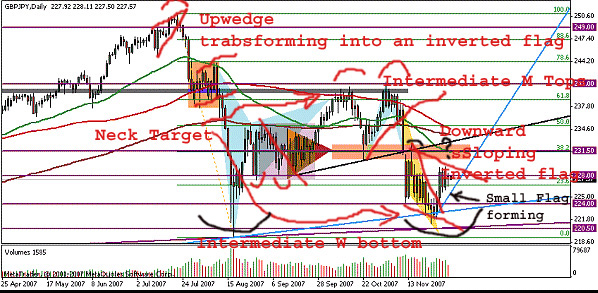
Note your up-sloping channel. It looks like a tunnel thru the air scenerio.
But pay attention to what I sketch on your chart,
to prove to you that the pattern can change ,
and leave you holding your old analysis in your head,
while new signals have developed to hint you for other possibilities.
1. You have because you have drawn two parallel lines of upward tunnelling.
So you have a perception of a continuing bull market.
2. Watch as I add new development, which hints you of impending change ,
but will not be visible to you, because of your lines.
Notice how the market has changed within your channel, range 1r(in red),
that change can happen as in this case inside your percieved channel,
Selling possibilities had already existed within the zone marked 1,
which is inside your channel.
While you may still be awaiting your percieved neckline to break for confirmation.
By the time you get the confirmation you may be already too late in the move,
(david's complain of catch fish head and tails)
and you would have lost the major part of the move.
If you remove your paralell lines
you may see that you can redraw
a new head and shoulder neck breakage inside the channel.
This is only one example, And although it is hypothetical, there will be many possibilities
and I a sure you that in life analysis your lines will impair your ability
to read the patterns that may be forming.
Remove the lines and you will definately see much more possibilities unfolding.
I urge you , do not draw patterns on your charts,
learn to recognise them visually without markings,
you will find that once you master recognising them without having them
being drawn on the charts, you will have less possibilities of pre-concieved pattern errors.
regards
@ Green_David,
I do remember that you did posted a chart for my analysis,
I have not replied your post because you posted a daily chart,
And based on the chart , that market has moved into a range congestion.
Within that congestion time window
is where you will be hinted on the new possibilities that can develop.
What I want to tell you is that instead of trying to impose analysis on the chart,
one viewing of it already can tell you what to expect of the possibilities.
It is what it continues to form as time progresses that is more important.
Resistance and support levels are never absolute.It changes as time progresses.
Your trade positions must change as the chart progresses and a continued analytics be done.
DO NOT try to read it once and have a set mind of the possibilities of what to expect.
The analysis is an on going process and every new bar added will cause new developments.
Never read the patterns that form on the chart, rather recognise it when it forms,
and follow it with a trade position.
Chart patterns can mutate as time advances
and a fixed perspective to the pattern that has formed is dangerous
as it palalyses your ability to change when the dance changes.
Althought it is foundational that you should be able to read the pattern formations,
you should not draw those lines on to your chart.
They can form optical illusions to your mind and
impair your ability of new developments that is coming onstream in the charts.
Follow the development as I explain Zorans chart errs to him.
@ Zoran,
Regarding your posted chart.
Read what I have explained to David. further,
refer to your chart as I highlight the dangers of,
your drawing lines and patterns on your chart.
Note your up-sloping channel. It looks like a tunnel thru the air scenerio.
But pay attention to what I sketch on your chart,
to prove to you that the pattern can change ,
and leave you holding your old analysis in your head,
while new signals have developed to hint you for other possibilities.
1. You have because you have drawn two parallel lines of upward tunnelling.
So you have a perception of a continuing bull market.
2. Watch as I add new development, which hints you of impending change ,
but will not be visible to you, because of your lines.
Notice how the market has changed within your channel, range 1r(in red),
that change can happen as in this case inside your percieved channel,
Selling possibilities had already existed within the zone marked 1,
which is inside your channel.
While you may still be awaiting your percieved neckline to break for confirmation.
By the time you get the confirmation you may be already too late in the move,
(david's complain of catch fish head and tails)
and you would have lost the major part of the move.
If you remove your paralell lines
you may see that you can redraw
a new head and shoulder neck breakage inside the channel.
This is only one example, And although it is hypothetical, there will be many possibilities
and I a sure you that in life analysis your lines will impair your ability
to read the patterns that may be forming.
Remove the lines and you will definately see much more possibilities unfolding.
I urge you , do not draw patterns on your charts,
learn to recognise them visually without markings,
you will find that once you master recognising them without having them
being drawn on the charts, you will have less possibilities of pre-concieved pattern errors.
regards
Attached Image

1