Edit: 8/5/12
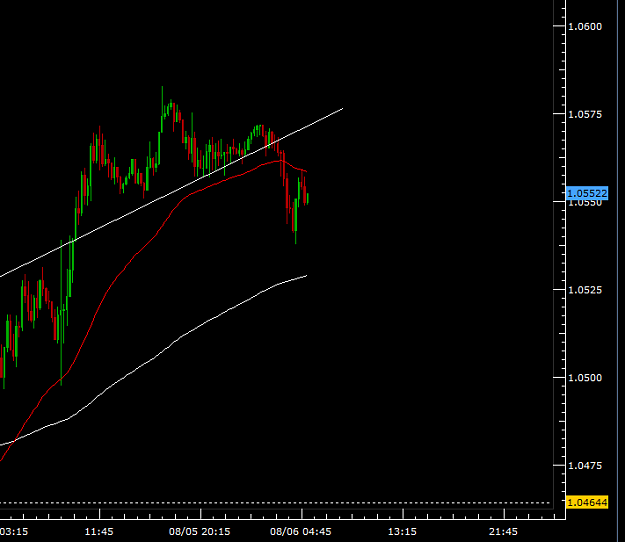
I'm trying to sharpen my edge with S/D, S/R, trend lines, geometry, and COT/volume. I may post a stock idea here and there, but I trade specifically spot forex for now. I would like to get into futures as well, but that will wait.
Edit: 8/7/12
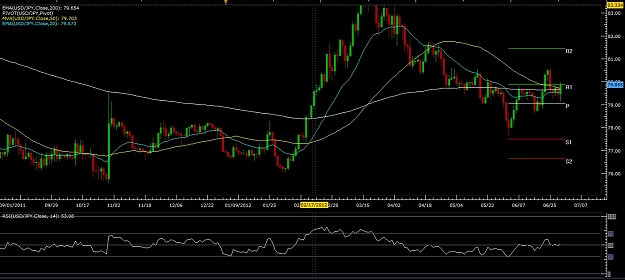
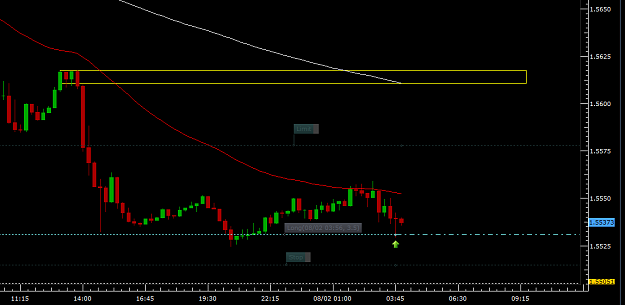
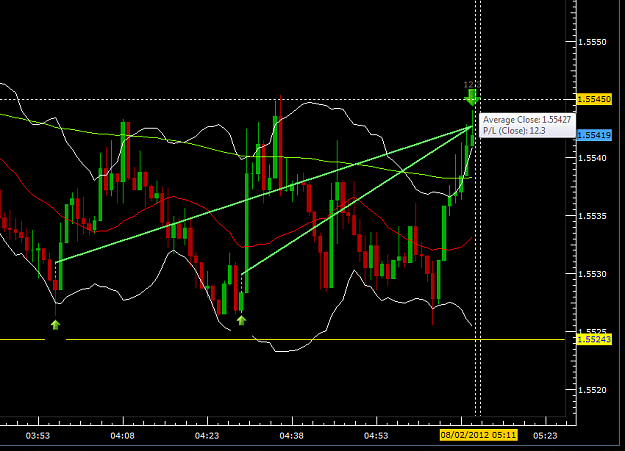
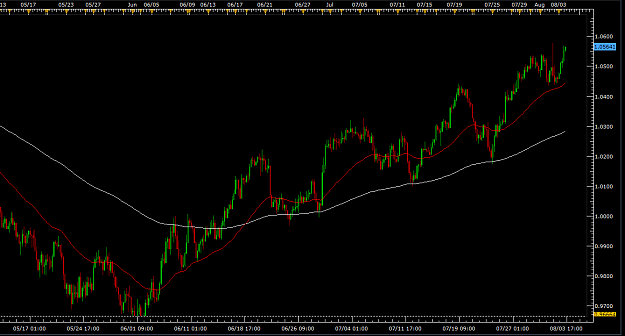
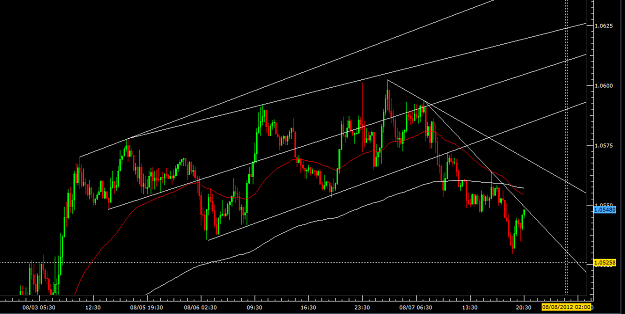
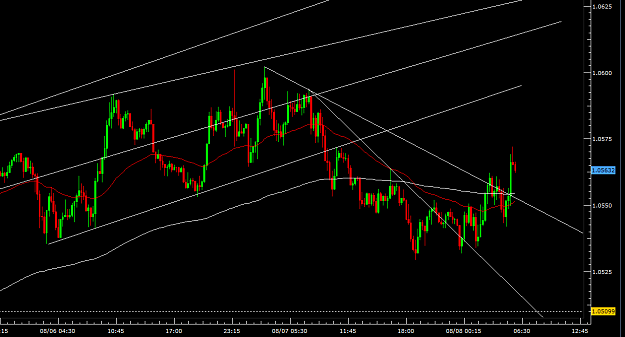
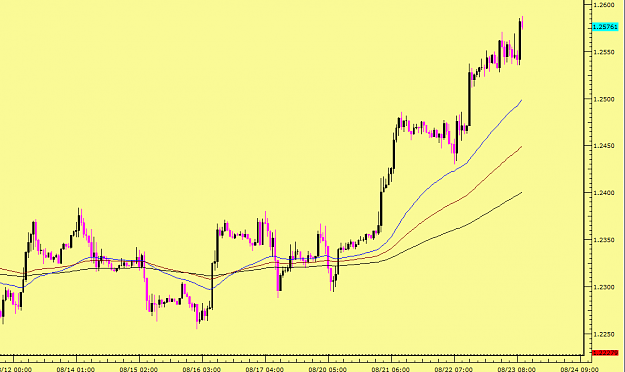
When price is above the 50 & 200 EMA, and the 50 is above the 200, I enter short. I may be long before price crosses above both and the 50 over the 200, but that's because the price was below the 50 and 200 while the 50 was below the 200.
I need to keep sticking to these rules 100% of the time. Every time I don't, it's always a loser.
Edit: 9/17/12
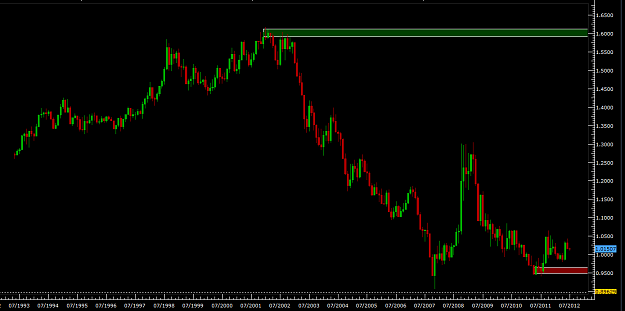
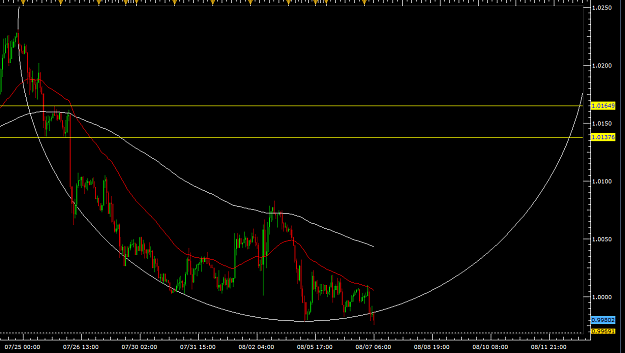
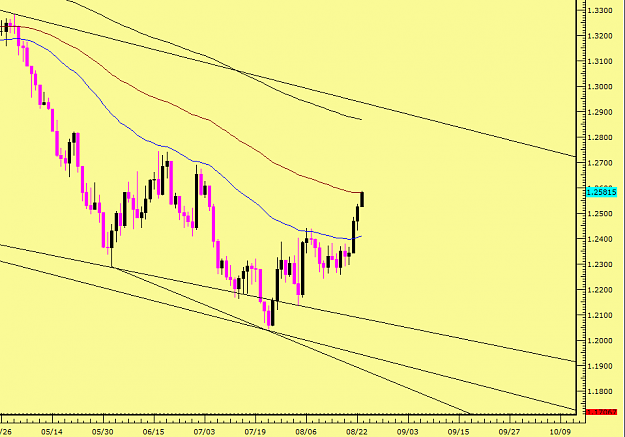
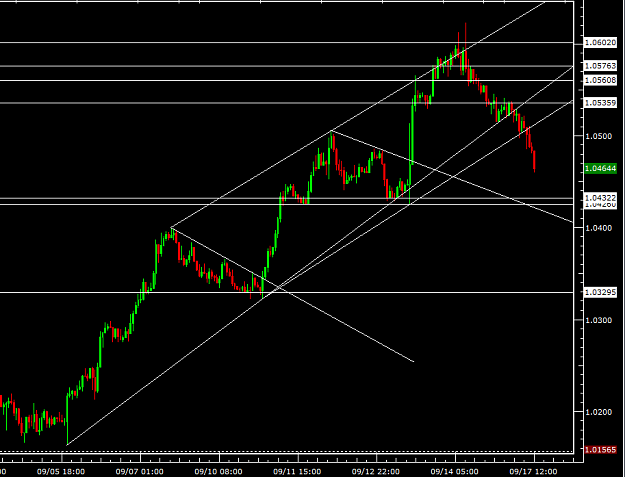
Took out all EMAs, charts are completely naked except for the lines I draw. S/D seems second nature, now. S/R combined with S/D creates geometry I can analyze. I use H-lines to determine levels of S/D, with lines being far apart indicating low strength and a handful of lines indicates strength. My H-lines are determined off of the open/close of a swing high/low and it's retracements. The larger the time frame, the stronger the lines, as usual. After I've drawn up my lines, I'll sometimes use the fib retrace or expand to see if my lines resemble the fibs. I'm still working on a good entry/exit system.
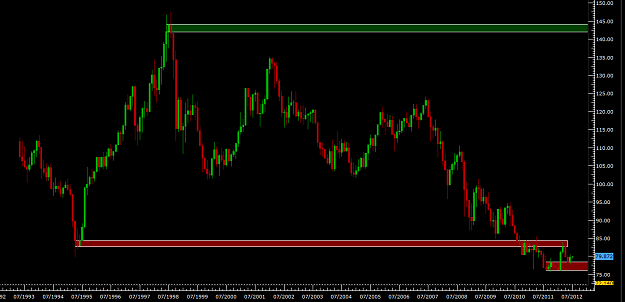
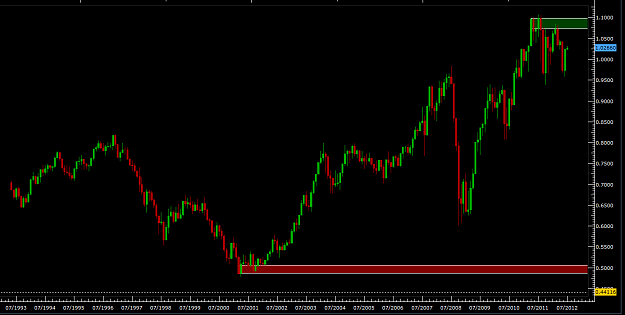
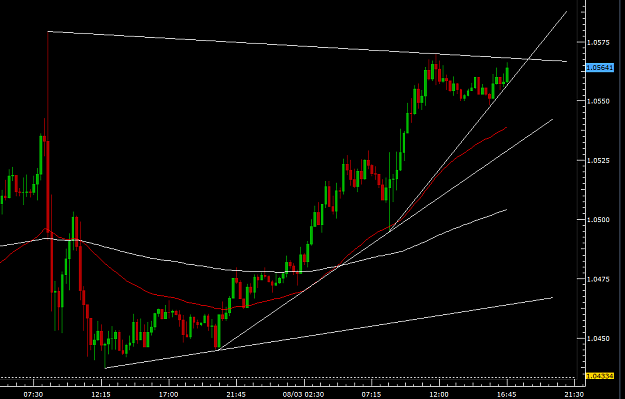
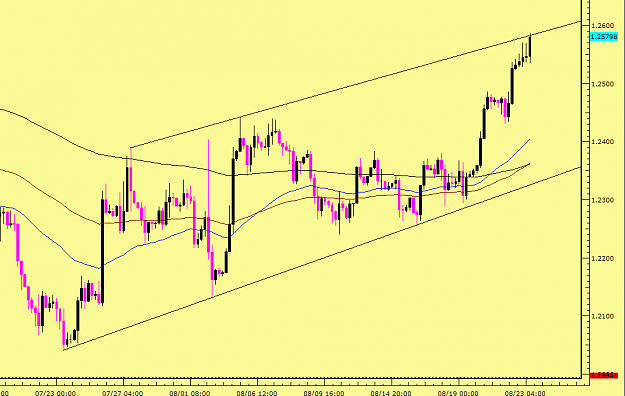
On the chart, the top four lines are based off the previous downtrend. The highest open/close, then the retracements, using only the highest open/close. The bottom three lines are based on the uptrend visible on the chart below. I didn't put a line on the swing low because price isn't near that level at all, but I did use the lowest open/close of the retracements.
I hope this makes sense.
I'm trying to sharpen my edge with S/D, S/R, trend lines, geometry, and COT/volume. I may post a stock idea here and there, but I trade specifically spot forex for now. I would like to get into futures as well, but that will wait.
Edit: 8/7/12
When price is above the 50 & 200 EMA, and the 50 is above the 200, I enter short. I may be long before price crosses above both and the 50 over the 200, but that's because the price was below the 50 and 200 while the 50 was below the 200.
I need to keep sticking to these rules 100% of the time. Every time I don't, it's always a loser.
Edit: 9/17/12
Took out all EMAs, charts are completely naked except for the lines I draw. S/D seems second nature, now. S/R combined with S/D creates geometry I can analyze. I use H-lines to determine levels of S/D, with lines being far apart indicating low strength and a handful of lines indicates strength. My H-lines are determined off of the open/close of a swing high/low and it's retracements. The larger the time frame, the stronger the lines, as usual. After I've drawn up my lines, I'll sometimes use the fib retrace or expand to see if my lines resemble the fibs. I'm still working on a good entry/exit system.
On the chart, the top four lines are based off the previous downtrend. The highest open/close, then the retracements, using only the highest open/close. The bottom three lines are based on the uptrend visible on the chart below. I didn't put a line on the swing low because price isn't near that level at all, but I did use the lowest open/close of the retracements.
I hope this makes sense.
Attached Image (click to enlarge)
Play the players, not the cards.