- Search Forex Factory
- 63 Results
-
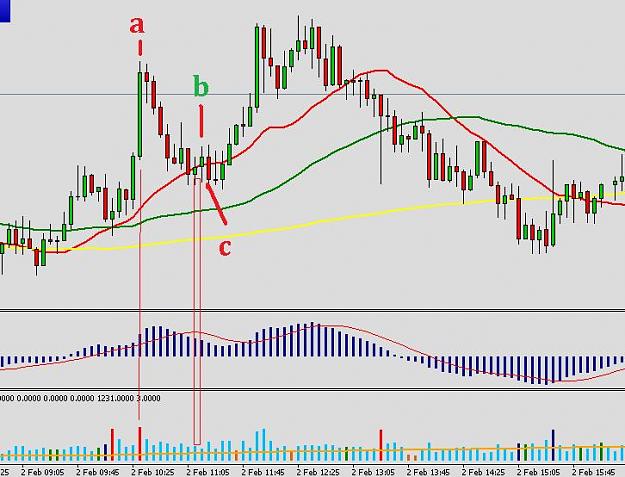
 wajid replied Feb 2, 2015
HI all, Can any one tell me how to read it. A: High spread on high volume weakness B: Up bar narrow spread on up bar lower than leave of the high spread bar A C: Down bar volume higher that previous nd bar. Confirmation of ND bar. But price goes up. ...
vsa with Malcolm
- wajid replied Sep 8, 2010
ftse — Hi mal Can you please post Ftse 1hr or 4 or daily chart. Below is my h4 shart i have seen last day lo vol on top channel. and i am expecting down move to bottom channel. Becoz i am short and have more the up to -150 GBP in this short. ...
vsa with Malcolm
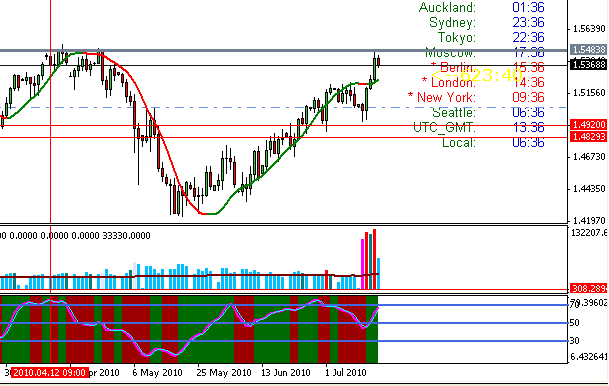
- wajid replied Sep 3, 2010
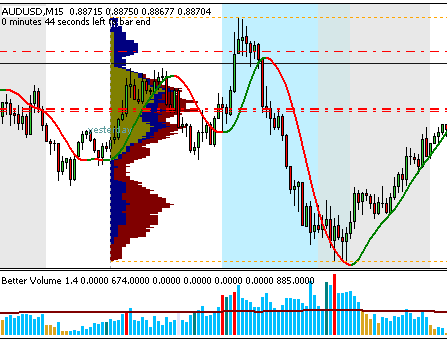
AU — High volume on top up bars Enough weakness or wait for action in Londo?
vsa with Malcolm
- wajid replied Sep 2, 2010
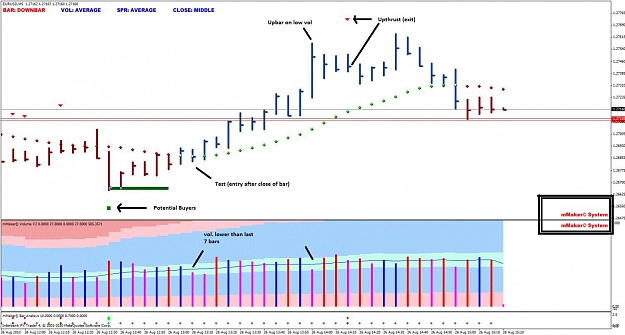
EU — high vol up bar top is near to previous top (yesterday) looking 4 sell setup
vsa with Malcolm
- wajid replied Sep 2, 2010
eu uc chart — GIF file sorry for that. click on pic to enlarge and clear view.
vsa with Malcolm
- wajid replied Sep 2, 2010
USD/CAD chart — also want to know ur openion about EU Regards
vsa with Malcolm
- wajid replied Sep 2, 2010
EU — Thanks Malcolm Here is another chart of eu H4 Two selling bars according to my analysis
vsa with Malcolm Does b bar show another sinal of weakness but hull is still green rsx is red is in 70 areas going down. should we wait for another weakness If there ...
- wajid replied Sep 2, 2010
uc H1 — Here is USD/CAD Stopping volume then Double bottom at low vol. Hull in green. a= volume is increasing shows buying interest. B= down bar at low vol spread is narrow shows no supply c= another low volume bar if it will close off the ...
vsa with Malcolm

- wajid replied Sep 1, 2010
USD/CAD — Stoping volume on UC? hourly chart. Wait for low vol to enter. am i right
vsa with Malcolm
- wajid replied Sep 1, 2010
first is stopping vol second is low vol test
vsa with Malcolm both at Daly pivot below is chart now doublle top at MR1.

- wajid replied Aug 30, 2010
FXCM Vol — Is there problem with fxcm volume. It seems to me. volume is very low on London open as compared to previous days.
vsa with Malcolm

- wajid replied Aug 30, 2010
clarification. — hi Last night i posted 1 link to indicator which was deleted. 1 think some one thought that i am spamming in this thread
vsa with Malcolm The link was look like a scam so it is good that it is deleted. But I want to explain all of you that I ...
- wajid replied Aug 26, 2010
IBFX DEMO AU — Here is my IBFX Demo it is same like Tffyler Frankkn check again is you r broker for mt4 demo acc is IBFX. Because mine is also Demo but volume in telling true story.
vsa with Malcolm
- wajid replied Aug 25, 2010
movement in price — I am also student of vsa According to my analysis there are many thing which help to understand the movement in price ie. how far this move will go. 1 Back ground 2 Daily Range. 3 time of entry or move. 4 and Place of entry ...
vsa with Malcolm

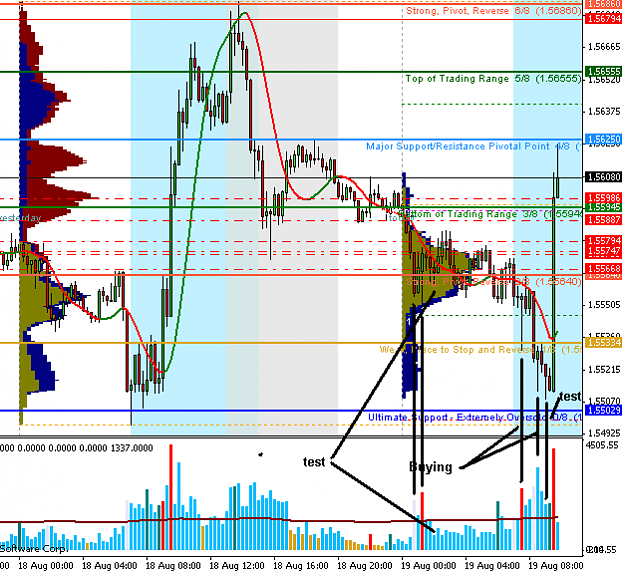
- wajid replied Aug 19, 2010
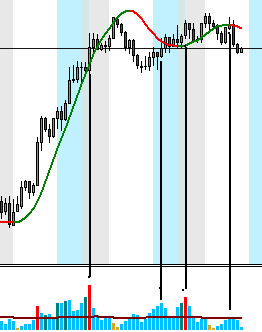
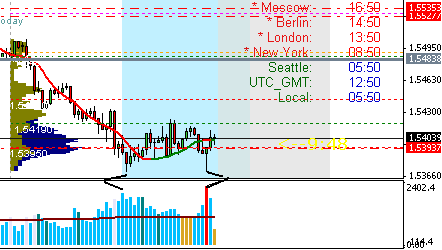
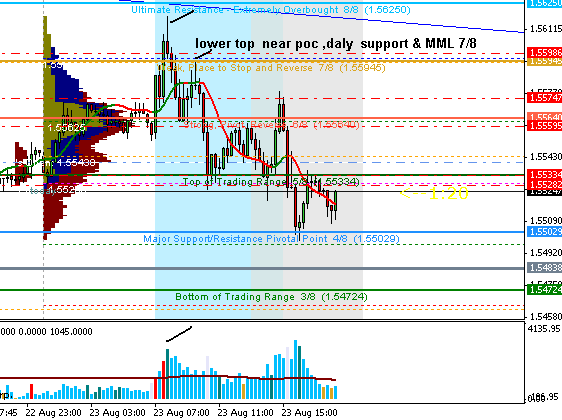
buying. — Hi found buying and test in asia session and then a test. and then in uk session (sky blue area) again high buying at 1.5533 and then stoping volume at 1.5510 and then low volume test. below in chart Is may analysis is right?
vsa with Malcolm