- Search Forex Factory
- 60 Results
-
 stersuhr replied Aug 25, 2010
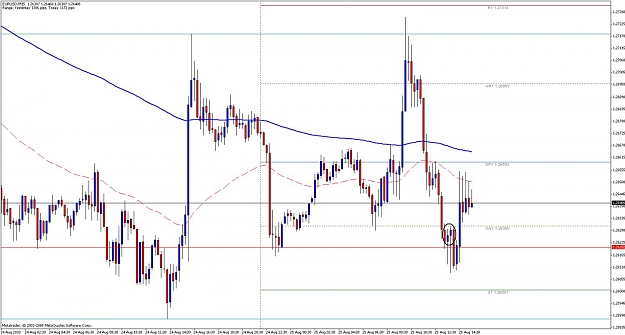
Euro Long for +15 pips — Here we took a nice long trade on the EUR/USD. As you can see in the black circle we had 2 great hammer formations at previous major support indicated by the red line. Additionally and equally as important if you look ...
Day Trading Forex Live - Live Trading Room
- stersuhr replied Jul 9, 2010
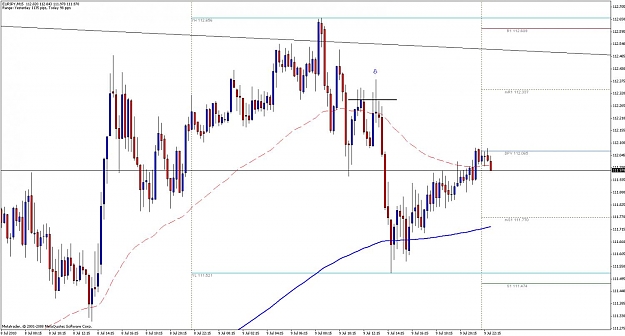
15 Reversal Candle on E/Y — Often times the most simplistic chart patterns are what work in this market, additionally they are the most overlooked as well. Most view simple approaches to the market as things that may have worked in the past ...
Day Trading Forex Live - Live Trading Room
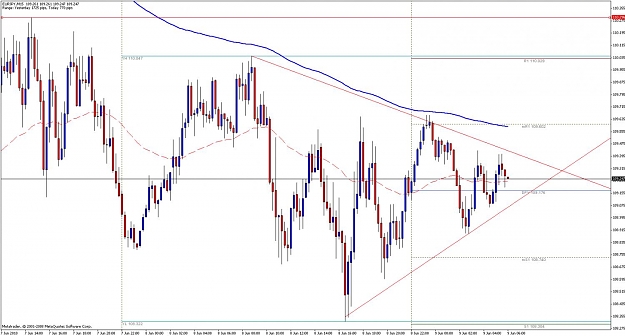
- stersuhr replied Jun 9, 2010
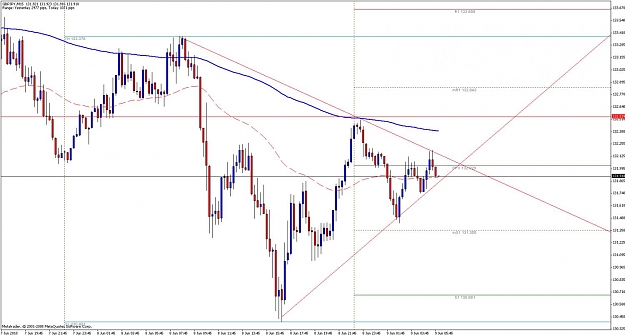
Potential Trade Setups — Here is a trade setting up on the G/Y and the E/J....a symmetrical triangle chart pattern. This is a trade setup that I love because it gives you tons of advanced warning that there is going to be a fairly large break ...
Day Trading Forex Live - Live Trading Room
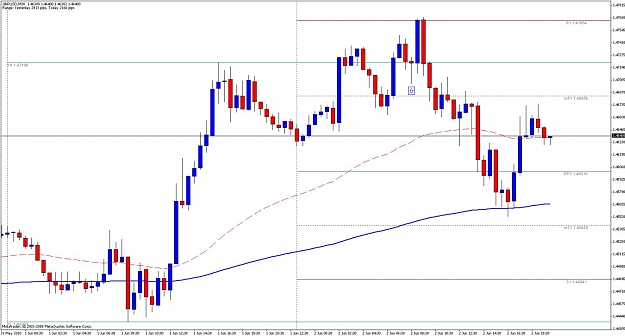
- stersuhr replied Jun 2, 2010
Trade From Todays London Session — Here was a nice trade from earlier today during the London session. There are 4 very simple points to look for in a trade setup. Often times you may only get 1 or 2 quality setups during a specific trading ...
Day Trading Forex Live - Live Trading Room
- stersuhr replied Mar 15, 2010
4H Reversal Candle EUR/USD — Currently we have a nice reversal candle on the EUR/USD to go long. This would be more of a swing trade type position but I thought I would mention it for those that like to trade the Asian session. Additionally we ...
Day Trading Forex Live - Live Trading Room
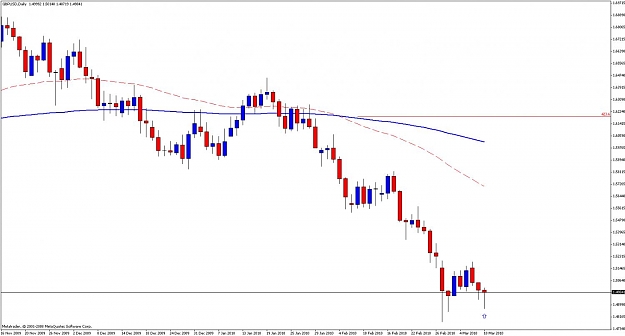
- stersuhr replied Mar 10, 2010
GBP/USD Daily Reversal Hammer Formation — Great daily hammer candle formation closing on the GBP/USD. Also to be noted is the large doji on the weekly chart from the previous week. The two together is a recipe for the pound to continue to head ...
Day Trading Forex Live - Live Trading Room
- stersuhr replied Mar 10, 2010
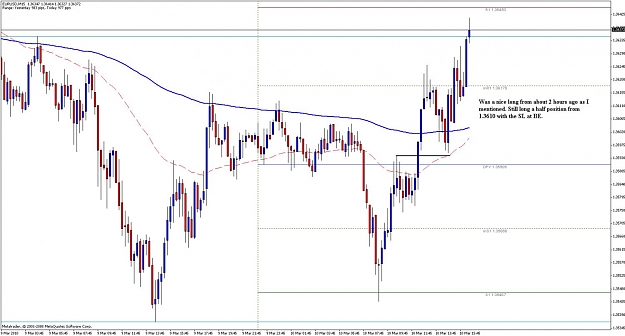
Closed half of the EURO long for +15 pips (right here) Moved the SL to BE and gonna let it ride for now, will update the last half on either a BE stop or the final TP. UPDATE Added a chart that shows the support that turned resistance providing a ...
Day Trading Forex Live - Live Trading Room
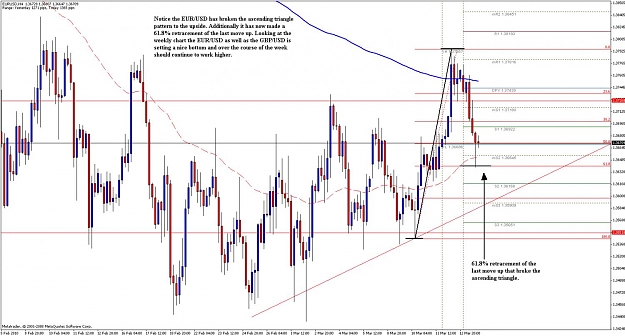
- stersuhr replied Mar 3, 2010
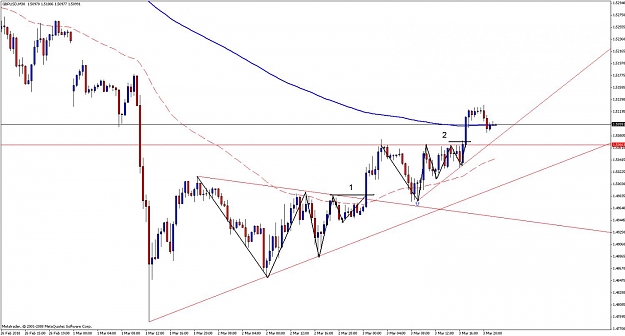
Forex Entry Signal — Here is a great example of a chart pattern (1) confirming the short term trend in the GBP/USD and then a pullback to the previous resistance now acting as support (The blue arrow indicating the candle talked about on the ...
Day Trading Forex Live - Live Trading Room
- stersuhr replied Feb 24, 2010
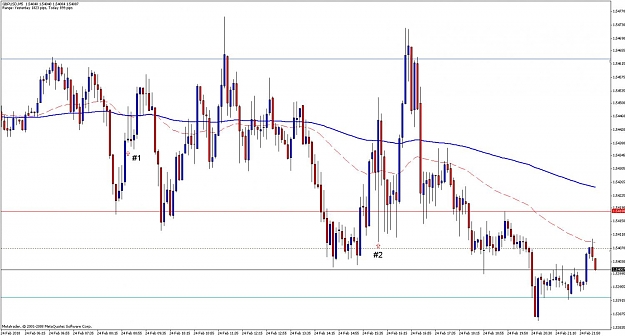
A few recent trades — With negative day trades as well as positive day trades you can gather a lot of information by looking at the results. Trade #1 - Following the 2AM open the GBP/USD continued to sell off. As expected there was a ...
Day Trading Forex Live - Live Trading Room
- stersuhr replied Feb 19, 2010
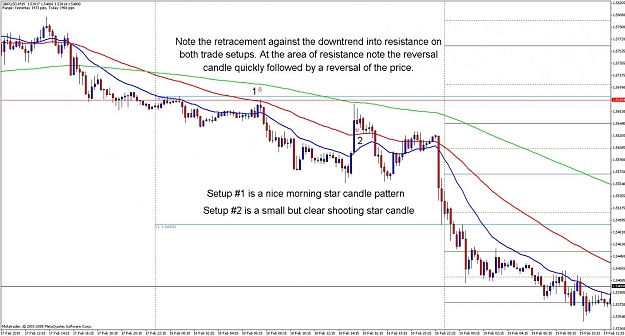
Using Candles Effectively — Often times candles and candle patterns are used to signal the reversal of a trend. On the other hand we have all heard the say "the trend is your friend". Those two points contradict each other do they not? So then ...
Day Trading Forex Live - Live Trading Room
- stersuhr replied Dec 12, 2008
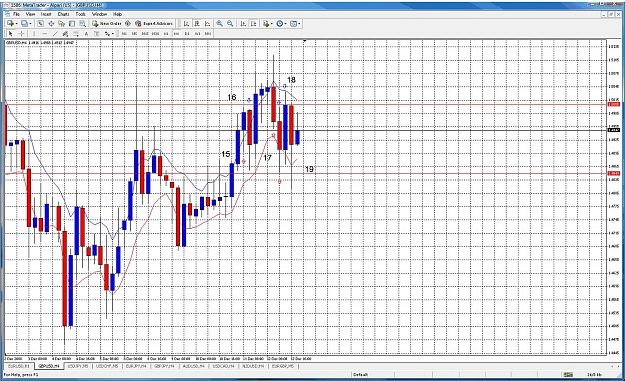
Trade #14 +56 pips Trade #15 -133 pips Trade #16 -60 pips Trade #17 -60 pips Trade #18 -156 pips Trade #19 -166 pips Well still a pretty crappy month we got goin on. Now were -662 pips for the month. Well I kinda dodged a bullet by taking a month of ...
4H 5EMA System
- stersuhr replied Dec 11, 2008
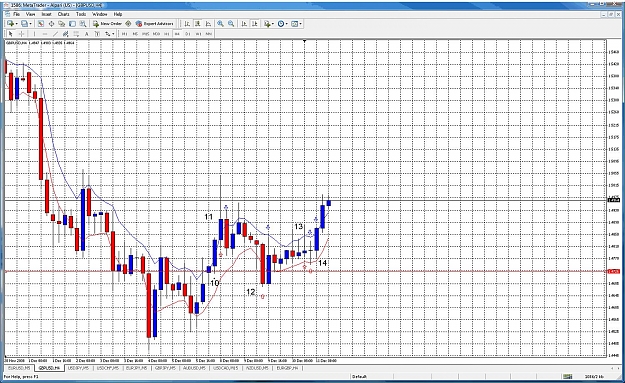
Chart bringing us current — Trade #10 - We wnet long when the market opened. Entry price was 1.4726 and then we closed the position when we got a sell signal. Close price was 1.4800 for a total profit of+74 pips. Trade #11 - When we exited the ...
4H 5EMA System
- stersuhr replied Dec 6, 2008
Chart bringing us to current — Trade #6 +31 pips Trade #7 -105 pips Trade #8 -111 pips Trade #9 -11 pips We are -88 pips for the month. Well we usually average about 30 trades a month and were a third of the way threw them. This choopy market ...
4H 5EMA System
- stersuhr replied Dec 2, 2008
The month of Nov closed +97 pips which kinda sucks but thats what it is. Trade #1 - On friday we closed are buy before the market closed. When the market opened nothing had changed so we re-entered are buy at 1.5395 The last bar on friday was a ...
4H 5EMA System
- stersuhr replied Nov 29, 2008
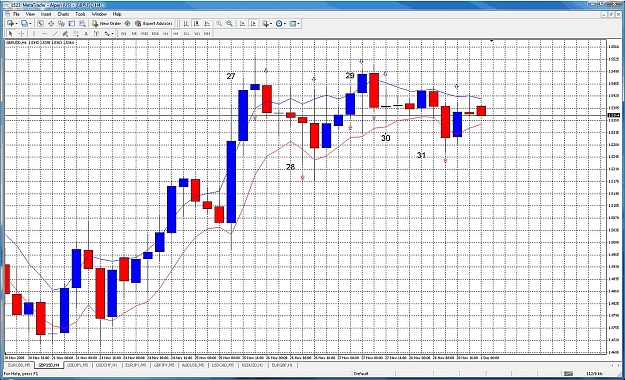
Chart bringing us current — Trade #27 - We sold at 1.5378 and got a buy signal at 1.5373 so we exited for a +5 pip profit. Trade #28 - We had a buy signal triggered at 1.5373 and got stopped out in the same bar at 1.5218 for a -155 pip loss. ...
4H 5EMA System
- stersuhr replied Nov 26, 2008
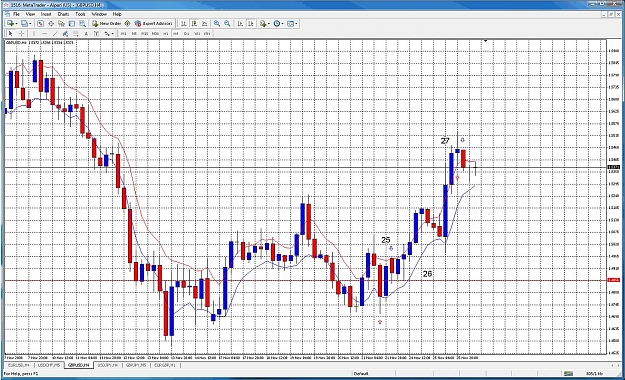
Chart Bringing us current — Trade #25 - We went long from 1.4942 and exited when we got a signal to go short at 1.4856 for a -86 pip loss Trade #26 - Was triggered at 1.4856 and was stopped out in the same bar at 1.4974 for a -118 pip loss. ...
4H 5EMA System
- stersuhr replied Nov 21, 2008
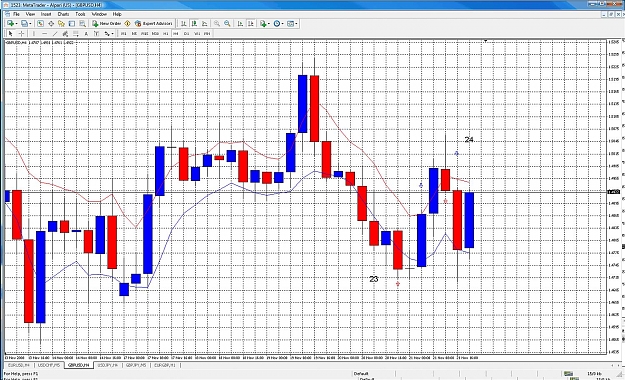
Chart For Nov 21st — Trade #23 - We went long from 1.4843 with a original stop loss of 1.4706 The trade continued in are favor for a while and then gave a signal to go short, at which point we exited the long and went short. The price we ...
4H 5EMA System
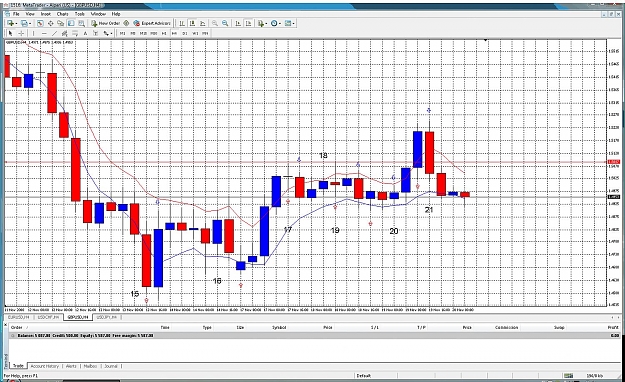
- stersuhr replied Nov 20, 2008
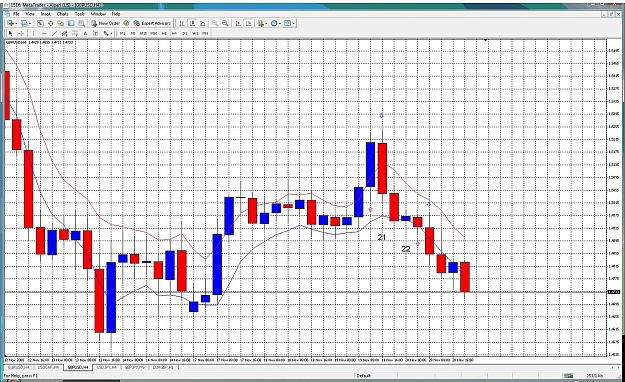
nov 21st chart of the day — Trade #21 - We are short from 1.5014 and got stopped out for a +31 pip profit. Trade #22 - We went long from 1.4983 and got stopped out at 1.4911 for a -72 pip loss. Pretty good month going. We have a closed total ...
4H 5EMA System
- stersuhr replied Nov 20, 2008
Nov 20th Chart — Sorry Ive been slacking a bit on the charts, I was getting burned out a bit. Here is the chart that brings us current. We are up +595 for the month and have a short going right now that is well in profit. Trade #16 +298 pips ...
4H 5EMA System