- Search Forex Factory
- 8 Results
- sri replied Nov 26, 2007
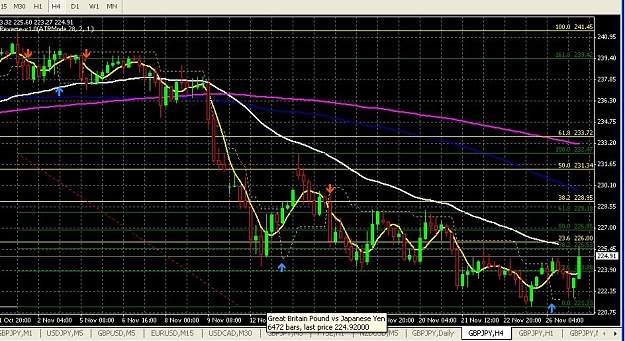
Well, intervention or no intervention, Technically, GJ just made a 38.2 retrace to 225.45 from 232 on nov 13th( 232.47--> 221.3) image
Auslanco - GBP/JPY and GBP/USD (newstrade)
- sri replied Nov 8, 2007
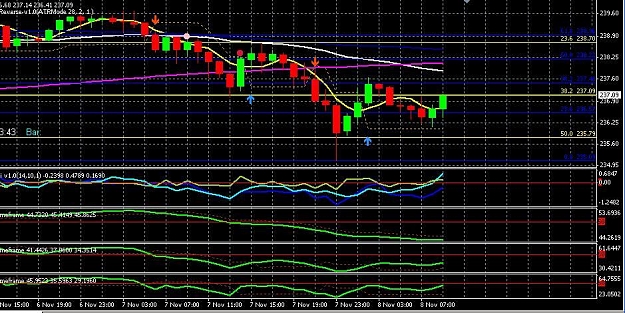
Yellow fibs = Previous bull run Blue fibs recent bear run from 240 to 235 yesterday. Price waffled a little bit around the 38.2 retracement of bull run and then now currently testing the 38.2 retracement of yesterdays bear run. QQE 60 bearish on 1 ...
Auslanco - GBP/JPY and GBP/USD (newstrade)
- sri replied Nov 7, 2007
Bounce on 50 EMA on 4Hr candle.. Candle not closed yet .so not sure yet if it will hold. MOM 1c,10c and 14 c on 4 Hr still neutral 1 HR QQE 60, just turned bearish an hour back though still above 50( 52) 1HR QQE 5 and QQE 1 both bearsih. MOM 10C and ...
Auslanco - GBP/JPY and GBP/USD (newstrade)
- sri replied Nov 2, 2007
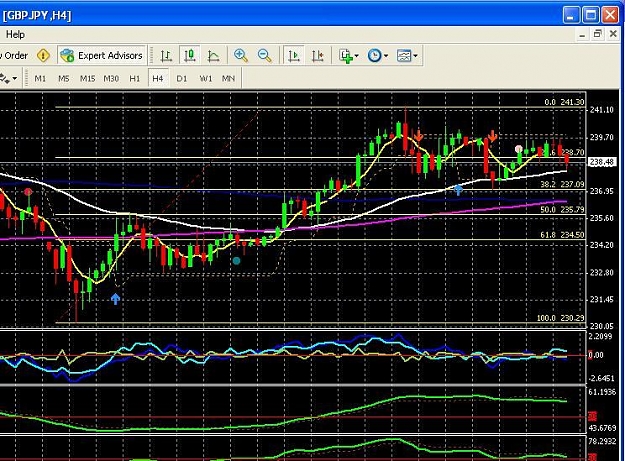
? Channel Trade — This is what i see on my charts. Smaller channel within a wider channel in last 8 hours. The upper TL is at 239.12. Will see if it bounces off that TL. This Channel is on a Hourly TF. image
Auslanco - GBP/JPY and GBP/USD (newstrade)
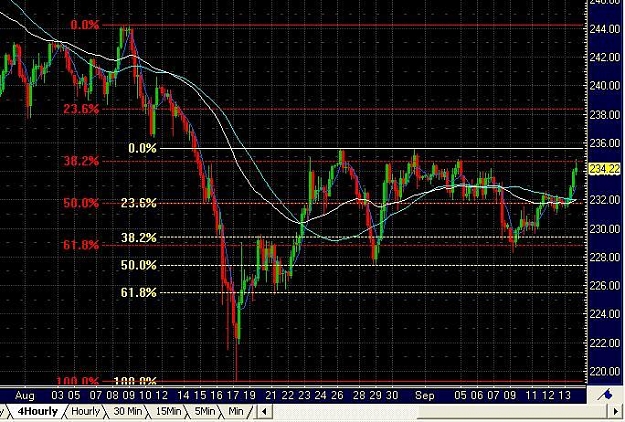
- sri replied Sep 13, 2007
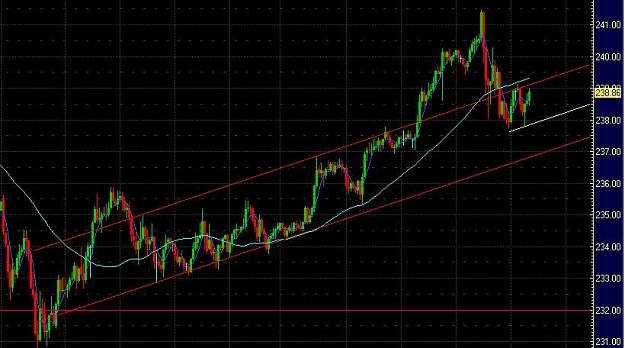
the resistence to the recent move up looks to me like 234.70 which is also the 38.2 Fib of the fall from 244 to 219. (Red Fibs) it is also the 200 ema on the 4H. what are others views on it? image
Auslanco - GBP/JPY and GBP/USD (newstrade)
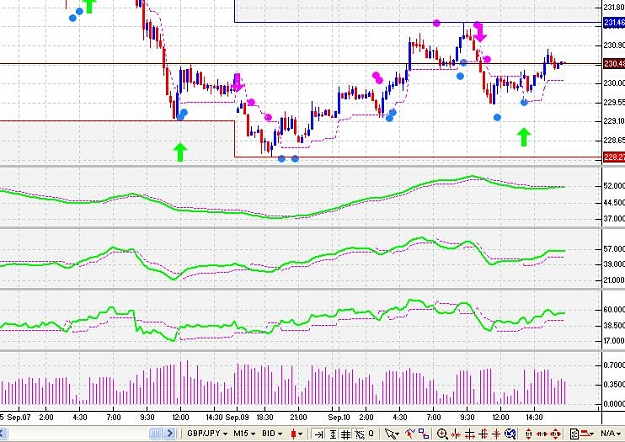
- sri replied Sep 10, 2007
Just wanted to share todays GBP/JPY channel..i am short from 230.75.. just waiting to see if it respects todays lowere trendline@ 230.11.... Does anyone use treadlines/channels on such shorttime frames? image
Auslanco - GBP/JPY and GBP/USD (newstrade)

- sri replied Sep 10, 2007
Can anybody tell me if there is a new QQE Alert indicator or are we using the old indicator??As i can see from my charts,i dont get the red line at 50 for crossover in the QQE60,QQE5 and QQE1. If i were to use QQE from the indicators section i can ...
Auslanco 15min GBP/JPY startegy
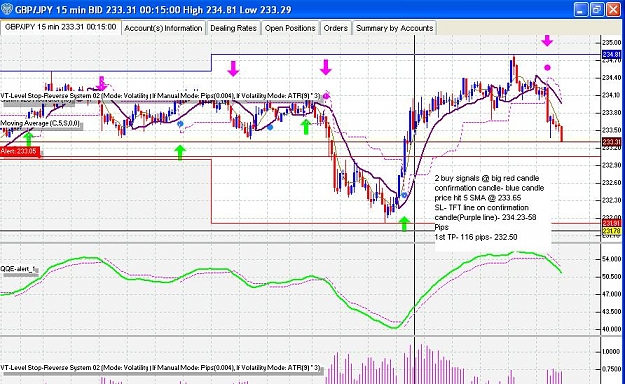
- sri replied Sep 5, 2007
Many thanks bill and lepricus for helping me to upload a picture. What i want to know is if my interpretation of the signal is right as i have explined in the text attached to the image. and if my application of the indicators is right. Many thanks ...
Auslanco - GBP/JPY and GBP/USD (newstrade)
- Posts by Member Search: 'sri'