- Search Forex Factory
- 31 Results
- snarlyjack3 replied Nov 15, 2015
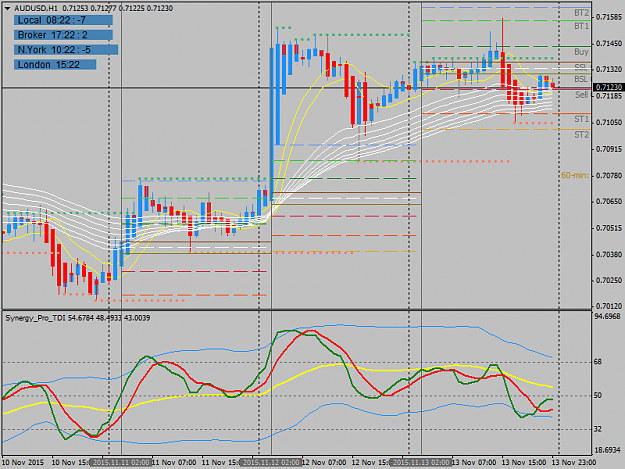
Let's look at a chart/picture, the aud/usd, 1 hour. (I can't see the picture so this is off of my memory). Do you see the long term guppy's & dot's levels & apb's. The dot level is getting very close to the sell level. But the long term guppy's ...
Trading Made Simple
- snarlyjack3 replied Nov 14, 2015
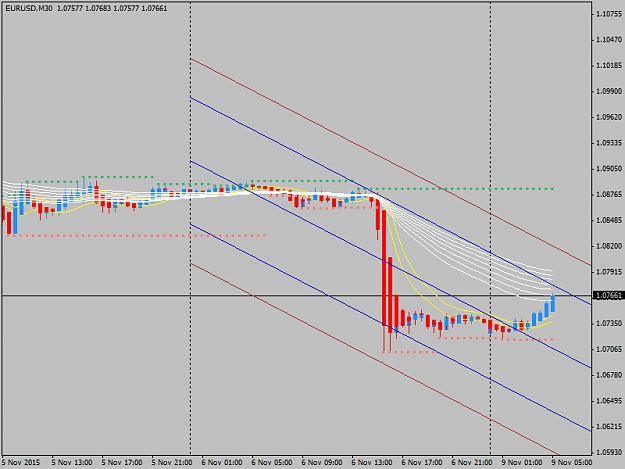
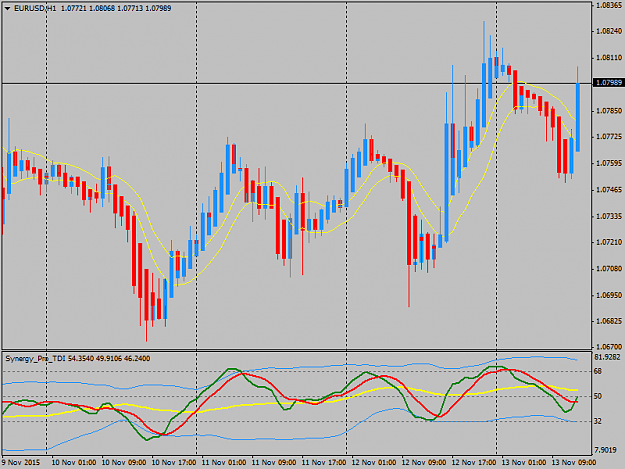
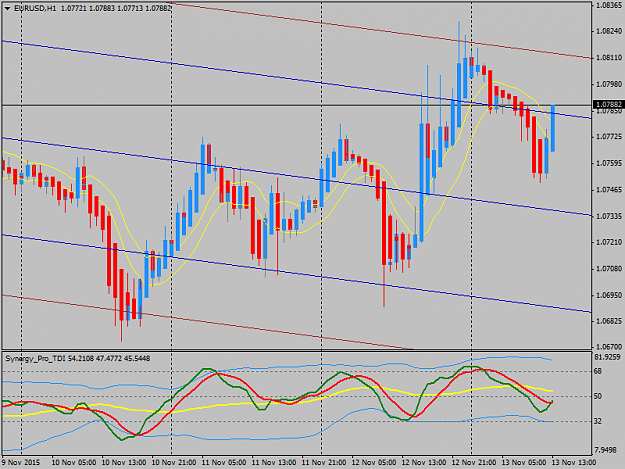
Here is a series of different time frames on the eur/usd so you can see how it looks. Ok...guy's I gotta go... Have fun. sj
Trading Made Simple
- snarlyjack3 replied Nov 14, 2015
Lastingwell, With your skills & market savvy... You could show me around London using this method... But I'm just a small mountain boy from Montana
Trading Made Simple I have absolutely no fight with Lastingwell at all!!! sj
- snarlyjack3 replied Nov 13, 2015
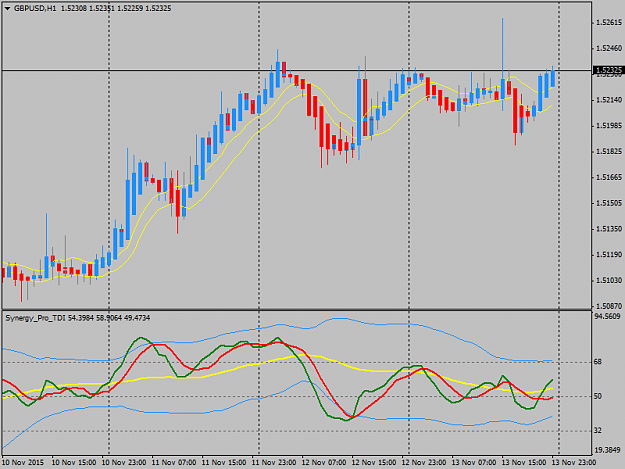
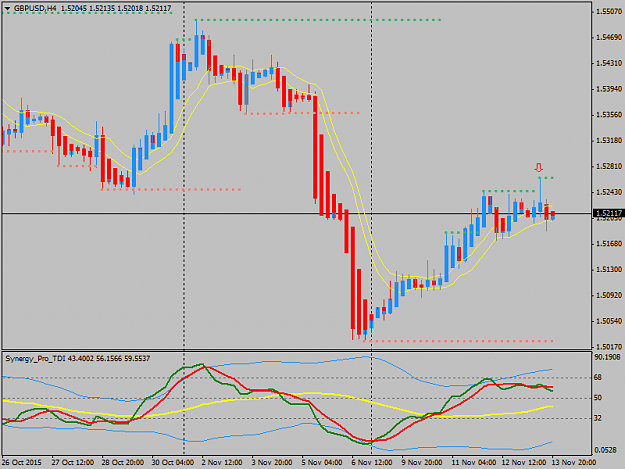
I just woke up from my morning nap! (I did get up at 3:00a.m. this morning). In checking my charts...I spy... a pin-bar on the gbp/usd. (when you spy pin-bars you want to take notice). This is what you are looking for... sj
Trading Made Simple
- snarlyjack3 replied Nov 13, 2015
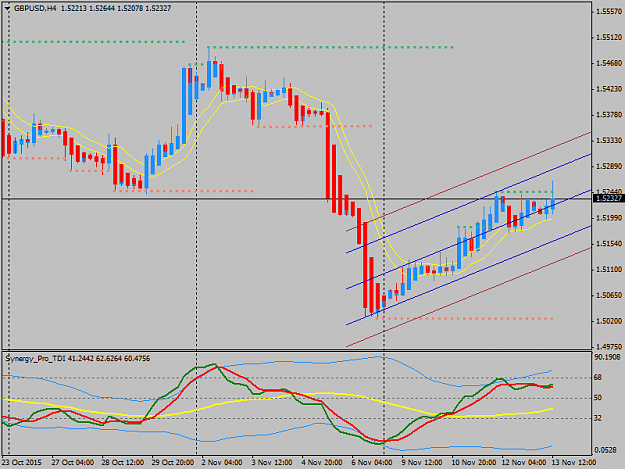
Ok... The new 4 hour apb is changing in 15 minutes. Let's see how it looks. sj
Trading Made Simple
- snarlyjack3 replied Nov 13, 2015
This is what makes Forex so frustrating... Forex is very unpredictable! You always want to use a stop loss. I put my stop loss on the other side of the pac price action channel. Forex is all about probabilities! Most trades work out...some trades ...
Trading Made Simple
- snarlyjack3 replied Nov 13, 2015
Ok...Here we go! Eelfranz was a great trader! Emmanuel is a great trader! Plus others using the Tms system are great traders. Now we all kinda trade the same, but we have personalized our trading to fit us. Everyone does this...you have to use what ...
Trading Made Simple
- snarlyjack3 replied Nov 13, 2015
Good morning everyone! (It's 4:15a.m. Montana time...6:15a.m. N/Y time). Winter is coming in Montana. Fall is drawing to a end. Most of my hardcore trading is done in the winter...summer is play time. Emmanuel is starting to take his summer ...
Trading Made Simple
- snarlyjack3 replied Nov 12, 2015
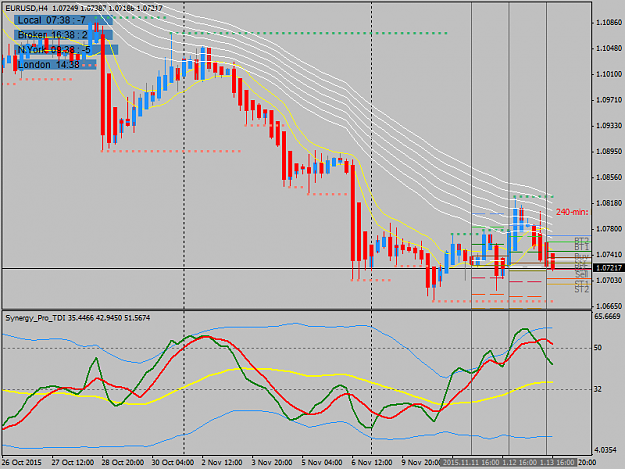
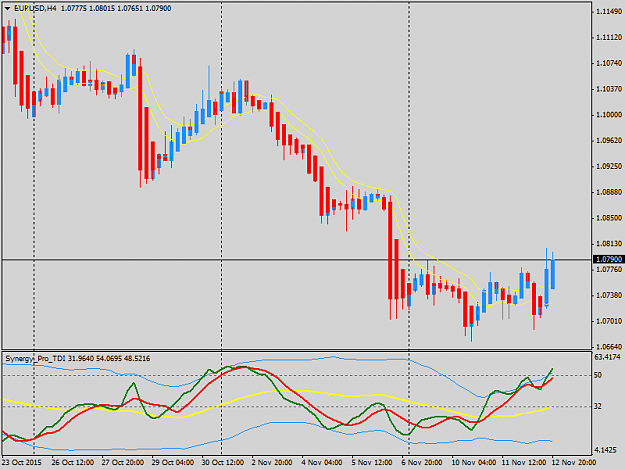
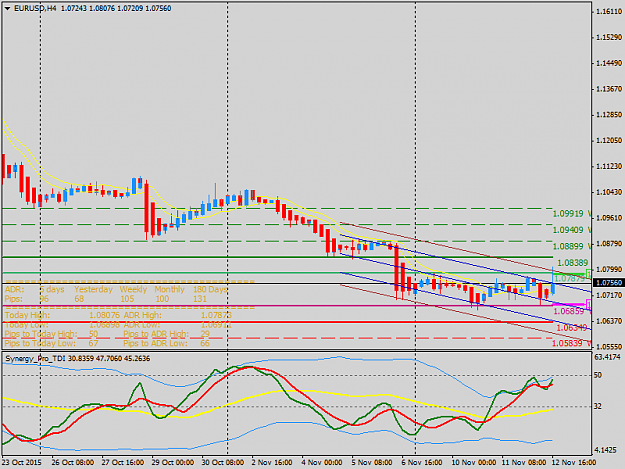
Arso, Yes...You got it! Price is shooting out of the pac. Good Tdi cross. (Bounce trade). I really don't look at trend (I'm not married to the trade). I trade all the time... See my clean/simple chart (eur/usd 4 hour chart). sj
Trading Made Simple
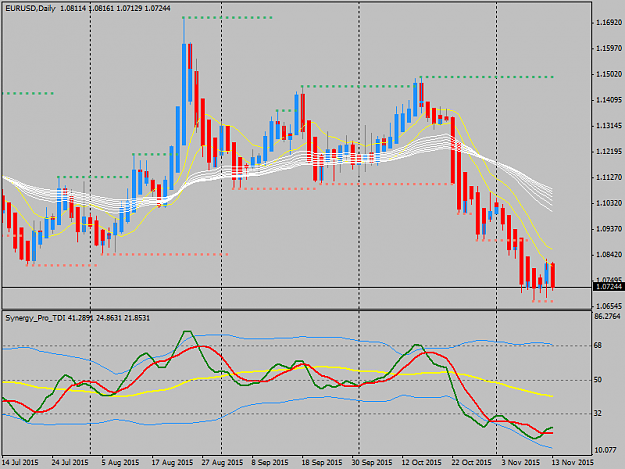
- snarlyjack3 replied Nov 12, 2015
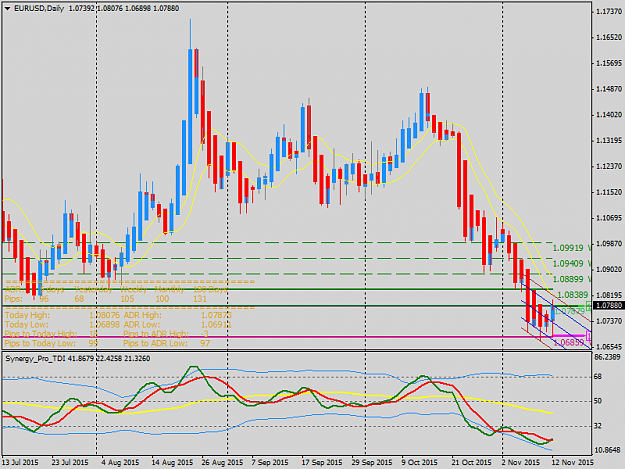
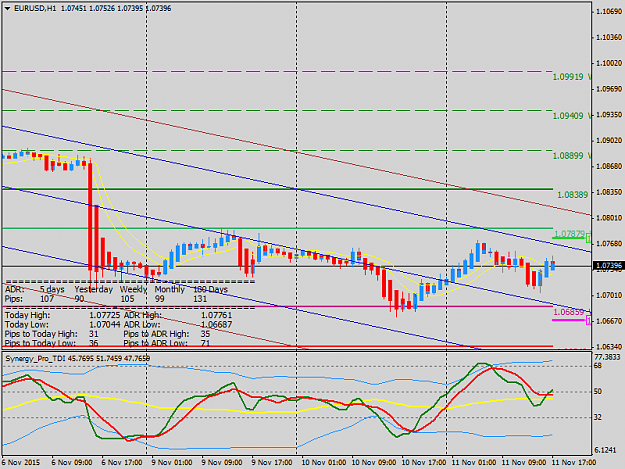
Goodolday, Take a look at my daily chart. Do you see the green line on the adr that says 1.08389. That would be my target. Might not get their...but it gives me something to shoot for... sj
Trading Made Simple
- snarlyjack3 replied Nov 12, 2015
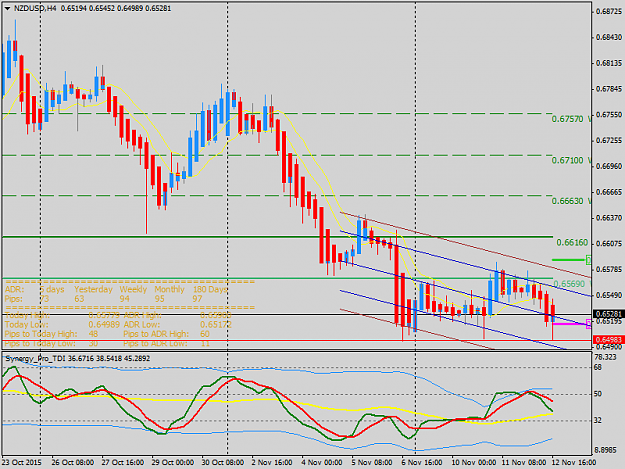
Ok... One more...You talked me into it! Look at the Nzd/usd (Emmanuel's favorite) 4 hour chart. Look how price came down (my red line) & made a triple bottom (exactly). I find that very interesting! You want to notice price action like that & go ...
Trading Made Simple
- snarlyjack3 replied Nov 12, 2015
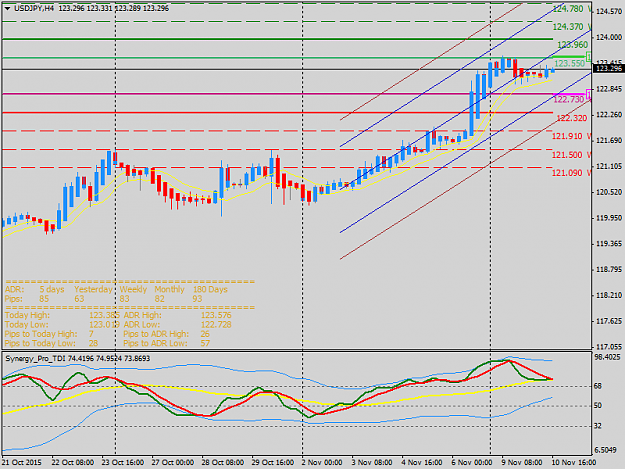
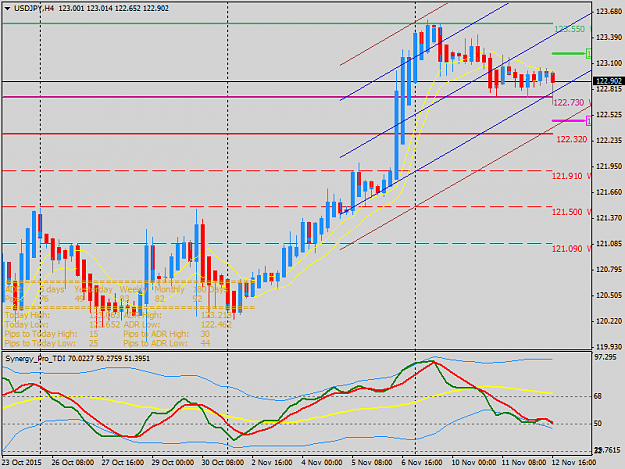
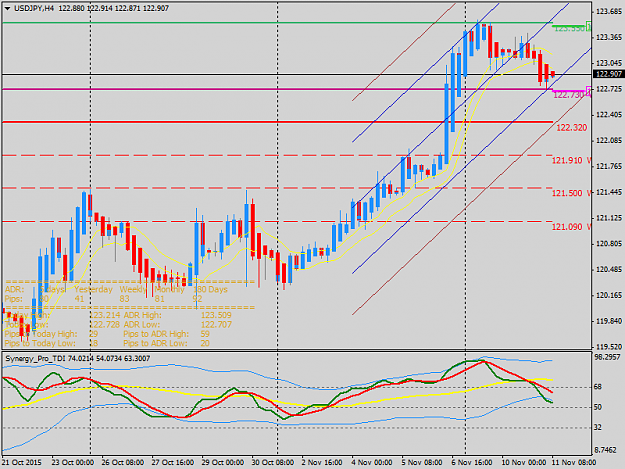
Ok...Here is another example. 4 hour usd/jpy chart. See how price went down...touched those levels & reversed. I can guarantee you that their are traders watching that action & going hmmm. (Nothing to do with the tdi at all...it's all price action) ...
Trading Made Simple
- snarlyjack3 replied Nov 12, 2015
Ok...This is what I find interesting! Check out the eur/usd on the 4 hour chart. Can you see where price went to the sdc top channel & sold off. I find that interesting that price played around with that level & reversed. (their is money to be made ...
Trading Made Simple
- snarlyjack3 replied Nov 11, 2015
This 3rd picture is of basic Tms that Eelfranz taught us. If you look at all 3 charts. Can you see that they are basically the same thing? The 1st picture shows s/r levels. The 2nd picture shows trend. The 3rd picture shows exactly how Eelfranz ...
Trading Made Simple
- snarlyjack3 replied Nov 11, 2015
Catalin, Emmanuel & I have been doing this trading for so long that it is 2nd nature to us. We don't mean to confuse you at all! But now your talking a different system (Tms with Guppy's). Not to confuse anyone! The guppy #'s are: ema (close) ...
Trading Made Simple
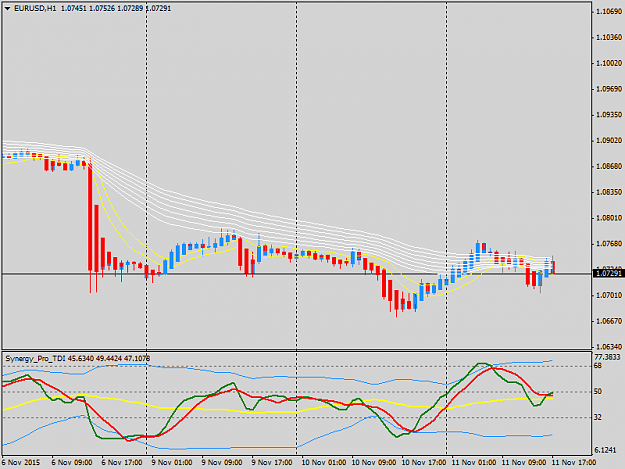
- snarlyjack3 replied Nov 11, 2015
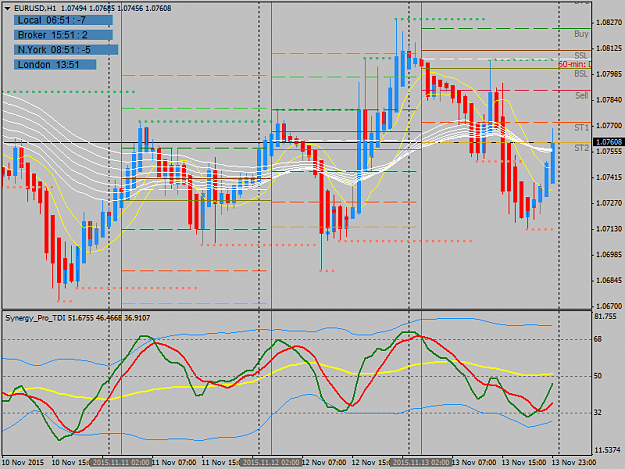
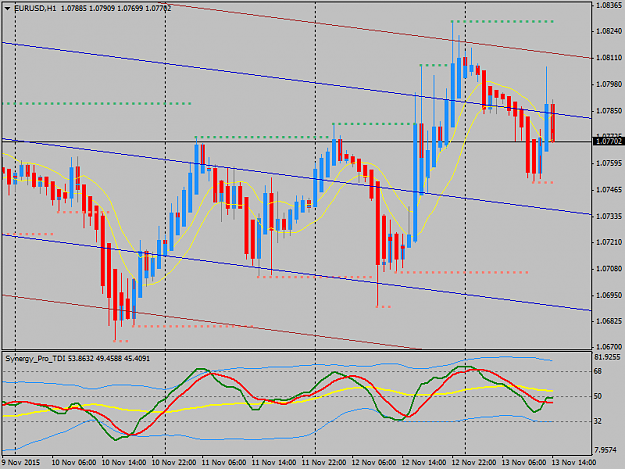
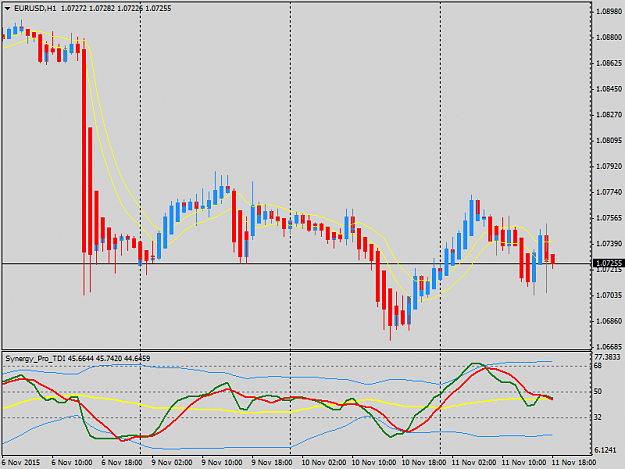
When I look at the eur/usd 1 hour chart I think to myself...this is a gradual wave. I don't see a lot of chop. Pretty clean, simple trading... I've seen a lot worse. sj
Trading Made Simple
- snarlyjack3 replied Nov 11, 2015
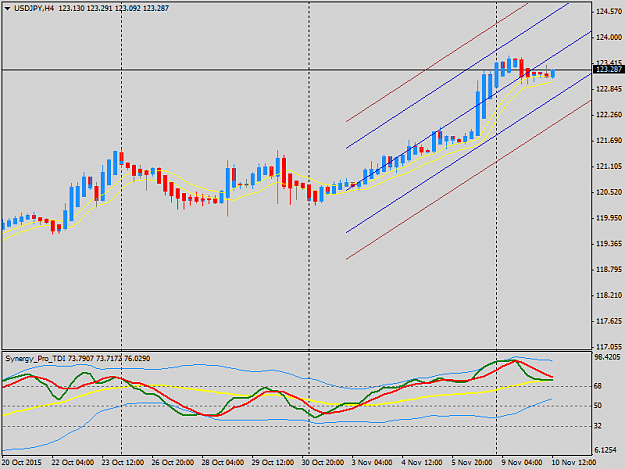
Dewdrops, Earlier this morning I was showing pictures of the usd/jpy & we were watching it. I was thinking that it might curl up & hit the top level. But it turned into a bounce trade & resumed down. What I find interesting about this chart is, the ...
Trading Made Simple
- snarlyjack3 replied Nov 10, 2015
Ok...I'm back, for a second. If you put in the Synergy Average Daily Range Calculator, it will show us our levels. Our levels are the Synergy SDC & Synergy ADR. Our levels give us our targets where price might go. They give us something to "aim" ...
Trading Made Simple