- Search Forex Factory
- 19 Results (1 Thread , 18 Replies )
- rcsltd replied May 21, 2015
Robinho mentioned GBPCAD was 1x8 at 11:09 (UK Time). Even during the start of the pullback you could have got 5 pips: - image
As simple as possible: 00 level trading

- rcsltd replied May 21, 2015
Hi Robhino First of all can I say that I am a big fan of yours and, in particular, your results
As simple as possible: 00 level trading I think the one thing that is confusing people is you do not seem to be using any of Udine's reasons for entry. Level 1 - there was no change of Ash ...

- rcsltd replied May 15, 2015
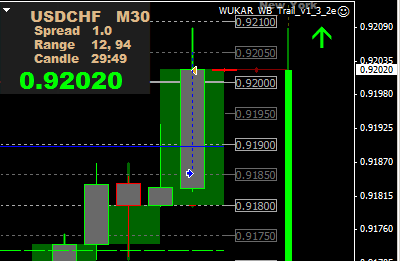
Has anyone done any experimenting with Yelena's idea of not closing the trade when it hits TP or SL but on the close of the candle that hit +5 or -10? This is from just now.
As simple as possible: 00 level trading
- rcsltd replied Jan 14, 2015
Shoot me down if I'm wrong but aren't we are after low risk trades. Going short after the HA goes back to red here is low risk (particularly the first one): - image But this isn't: - image
As simple as possible: 00 level trading


- rcsltd replied Jan 9, 2015
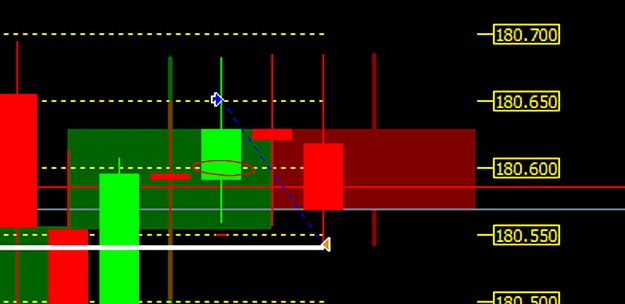
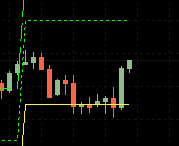
The first 00 cross after the close of the previous bar is 180.600 instead of 180.650 in which case you would've hit your TP. image
As simple as possible: 00 level trading
- rcsltd replied Dec 12, 2014
image I get a bit confused over these defnitions. Taking the bat pattern as the example AB = between 38.2% and 50.0% of XA BC = between 38.2% and 88.6% of AB CD = between 161.8% and 261.8% of BC AD = 88.6% of XA Is this right?
As simple as possible: 00 level trading

- rcsltd replied Nov 28, 2014
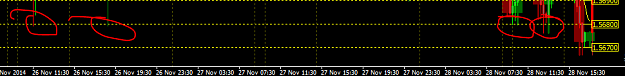
Check back a couple of days and you'll see a couple of tries (and failures) to go below 1.568: - image
As simple as possible: 00 level trading
- rcsltd replied Nov 14, 2014
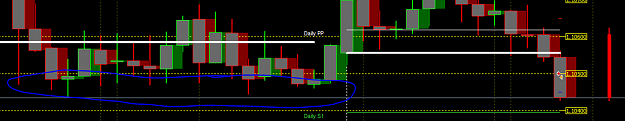
I wouldn't have called this one "low risk" though. Look at all the support where your TP is: - image And it's quite close to the Daily S1.
As simple as possible: 00 level trading
- rcsltd replied Nov 14, 2014
And the daily R1 is acting as....resistance! image There are plenty of other opportunities without having to take longs around resistance and shorts around support.
As simple as possible: 00 level trading

- rcsltd replied Nov 12, 2014
Now I'm confused. Is the strategy to open once the price closed above the 5MA or once the price closes "convincingly" above the 5MA? If I was using this strategy, as stated on page 1, I'd have bought here, not on the close of the next bar: - image
5 PIPS - Only Five

- Help needed with HotSpot IndicatorStarted Nov 4, 2014|Platform Tech|2 replies
I am trying to write an indicator that shows how often the price has changed direction at a ...
- rcsltd replied Oct 17, 2014
Hi This is a great system. One thing I've noticed on the screen prints is the very low spreads compared to my Alpari spread betting account. The post above this one is showing a spread of 1.1 for GBP/JPY. My Alpari account is showing 5.8. The system ...
As simple as possible: 00 level trading

- rcsltd replied Nov 15, 2013
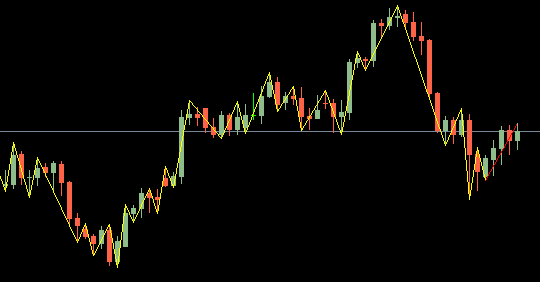
I've written a higher high/lower low indicator. Would this be of any use? The leg at the end is red because it's unconfirmed. image
Higher low, lower high system

- rcsltd replied Nov 15, 2013
Is this kind of this what you're after? The red leg(s) at the end are unconfirmed. image
How to program Higher-High Higher-Low
- rcsltd replied Oct 18, 2013
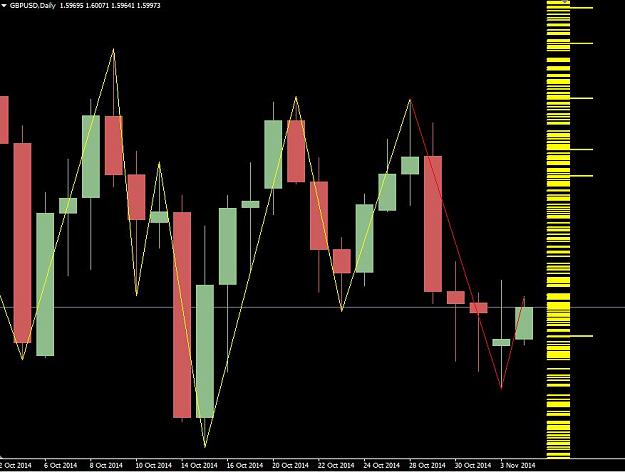
No, but looking a bit healthier now. image
Monthly Pivots on Daily Charts
- rcsltd replied Sep 13, 2013
Hi I've only just found this thread but it's very interesting. The closest thing to how I imagine professional traders trade. Looking at the daily GBP/USD how would you treat a return to 1.54239?
Fail Better


- rcsltd replied Jul 25, 2013
I know you use H1 as your intermediate TF but looking at it from a daily point of view using %R(14) there's only one chance to for a trade and that was when it looks like the trend *may* have come to an end. If I switch to %R(2) there are more ...
Third Screen Strategy - Dr. Alexander Elder


- rcsltd replied Jul 24, 2013
Hi Axlz Are these the points that you're talking about for CADJPY? image
Third Screen Strategy - Dr. Alexander Elder
- Posts by Member Search: 'rcsltd'