- Search Forex Factory
- 182 Results
- foxybunny replied Oct 5, 2015
Market Structure, Supply/Demand, Support/Resistance, and many Trendlines. Trendlines really depends on the timeframe and how it is drawn. Trendlines are tradeable, just need to re-draw many lines. You many only see like 3-4 trendlines on your ...
What works, and what doesn't
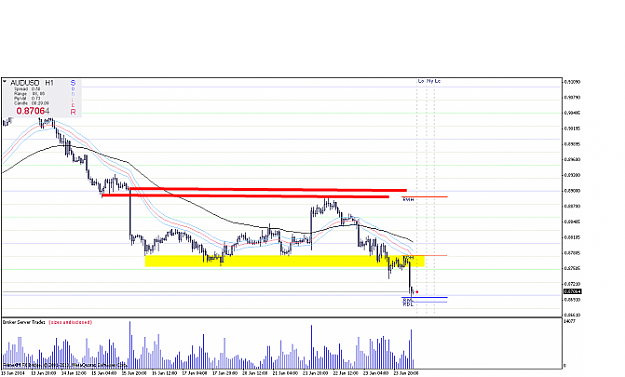
- foxybunny replied Jan 24, 2014
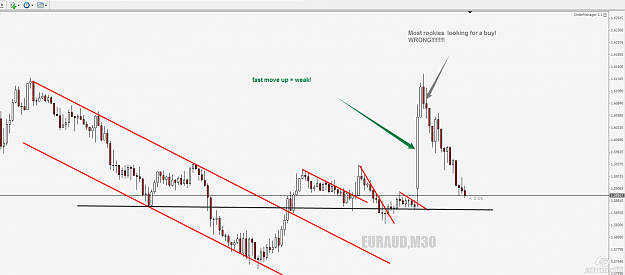
Perhaps I added the 2 red lines for you to see the Supply on A/U may help. Agreed with Sunbrella on A/U looking still going to drop further with his chart.
Sonic R. System
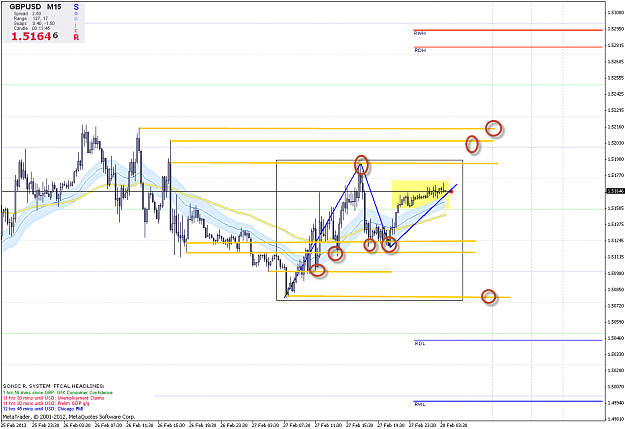
- foxybunny replied Feb 27, 2013
Hope it is OK I re-used your chart. Attached is modified chart of GU M15, showing Price Action reading with S&R and SonicR. Can you SonicR traders see better now where are the possible entries and exits near the ellipses? image
Sonic R. System
- foxybunny replied Feb 25, 2013
E/U 25-Feb H1 chart, have earlier Short entries that hit SL. All entries based on M15 or M5, not H1. Then saw the bigger Main Swing Down from 20-Feb till 22-Feb, and price retrace up on 25-Feb to around 62%, and took another Short that covered all ...
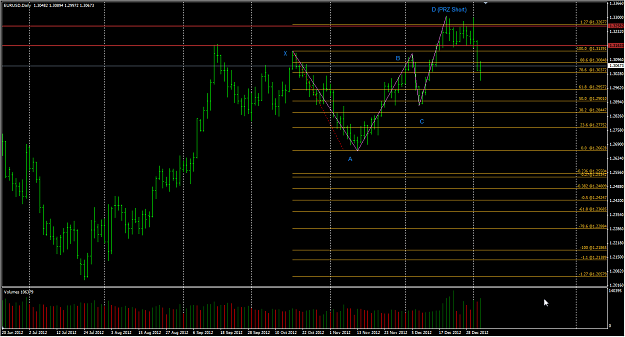
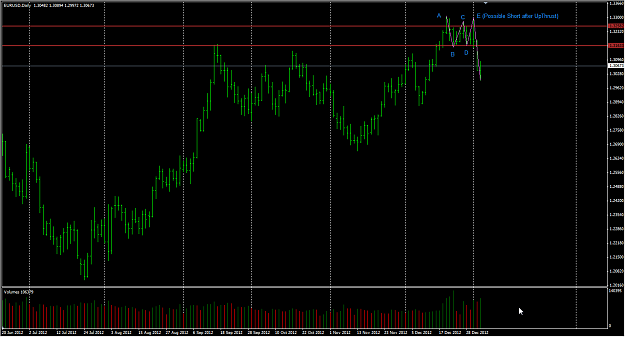
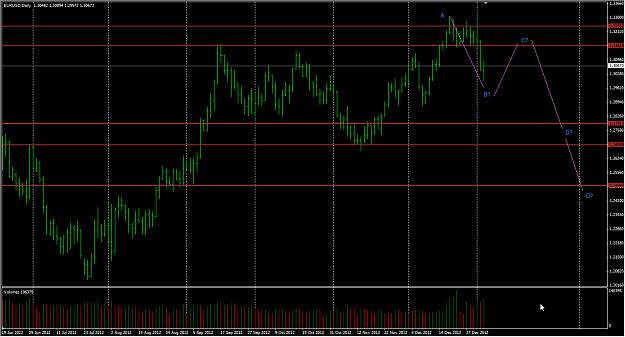
Ratios & Harmonics: a Different Way to Trade
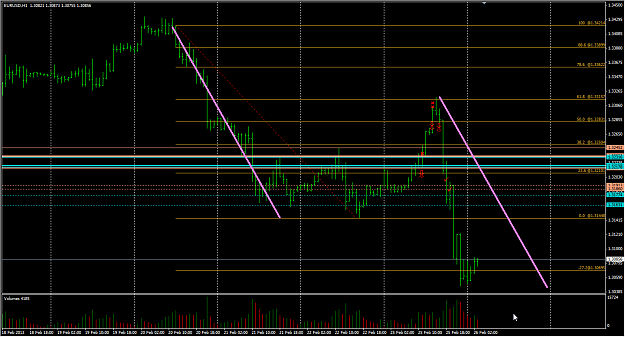
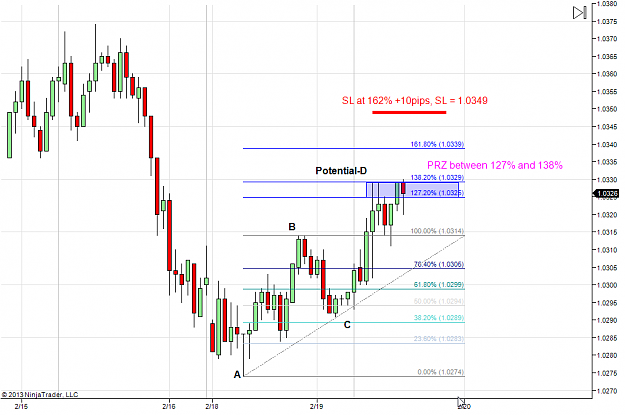
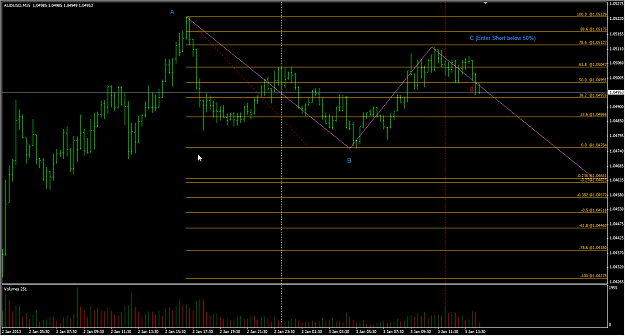
- foxybunny replied Feb 20, 2013
Following up my A/U H1 Aggressive ABC-Short chart posted earlier. Below is what the price action on 20-Feb, end up been a downtrend of around 100-pips for a Short. You can see now why I prefer the PRZ-2 over PRZ-1 in this scenario. Also here happen ...
Ratios & Harmonics: a Different Way to Trade
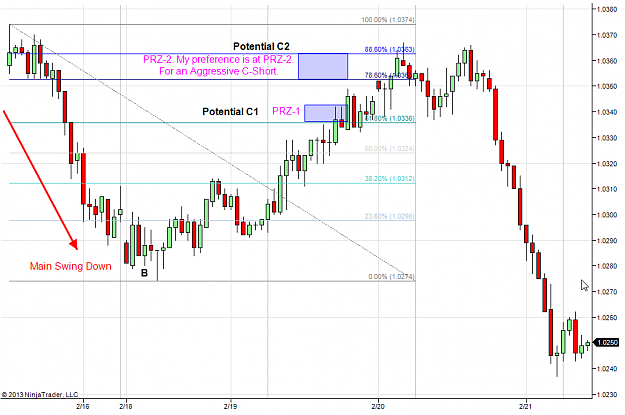
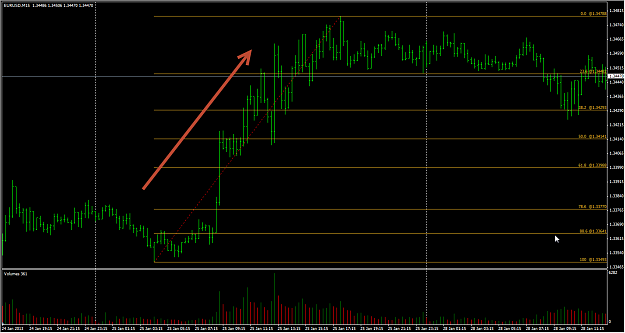
- foxybunny replied Feb 19, 2013
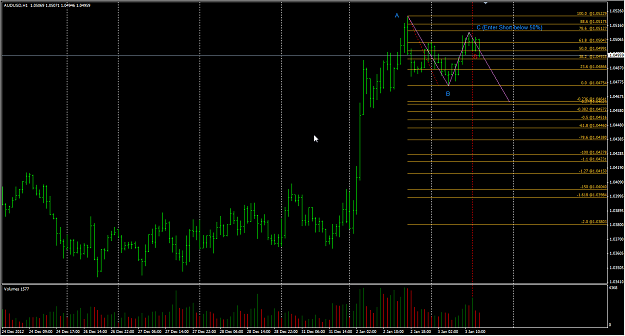
For A/U H1, this is how I would see it for an Aggressive ABC-Short. I will not be trading in A/U, this is just an example to show how I may see it as a different pattern using just ABC with the Main Swing, instead of ABCD. image
Ratios & Harmonics: a Different Way to Trade
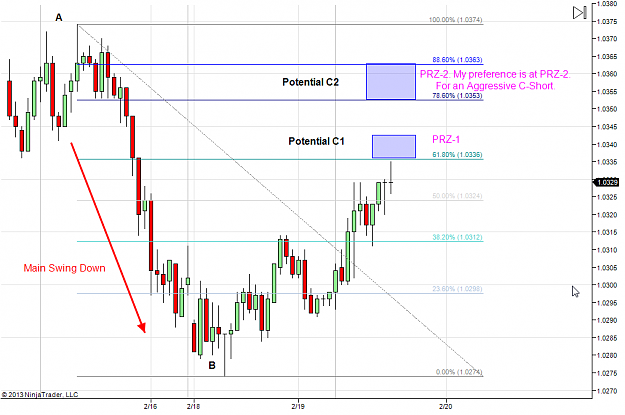
- foxybunny replied Feb 19, 2013
Nomadic, my A/U H1 chart showing the potential ABCD based on my understanding of the"Advance Pattern Reference Guide" and the "Rules Of Engagement". Hope you also refer to those documents before and after you put on your fib lines. PRZ is between ...
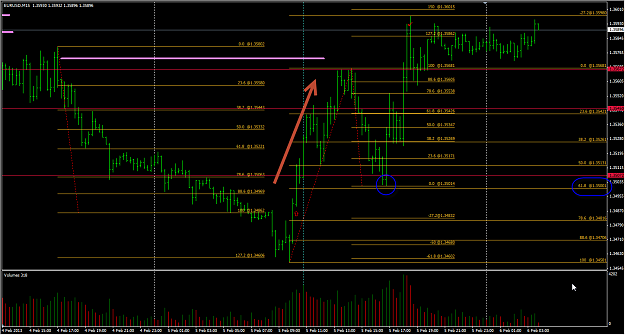
Ratios & Harmonics: a Different Way to Trade
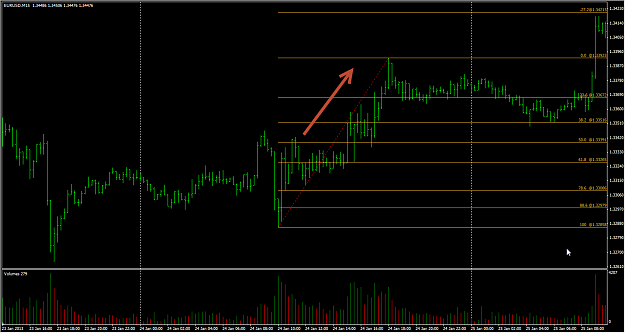
- foxybunny replied Feb 9, 2013
You both are looking at tick chart, hopefully my chart is same time period as both your charts. Another way looking at it differently using M15 chart. My E/U M15 8-Feb chart showed a simple ABC-Short at 61.8% below 1.3402, so in this M15 period ...
Ratios & Harmonics: a Different Way to Trade

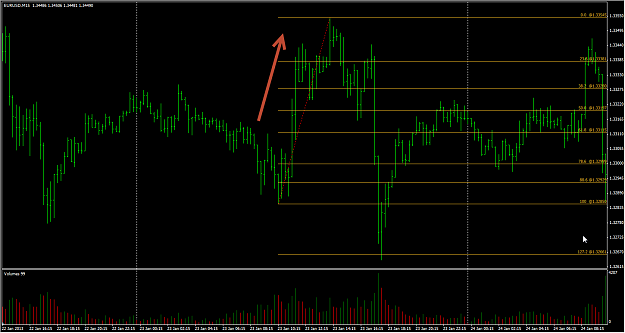
- foxybunny replied Feb 5, 2013
Can everyone see clearly where is the Main Swing for EUR/USD M15 for Tue 5-Feb-2013? Is that Main Swing in the Busy Active session? Is that Main Swing the Lowest Low and the Highest High at that point of time for that day? Is it Objective enough how ...
Ratios & Harmonics: a Different Way to Trade
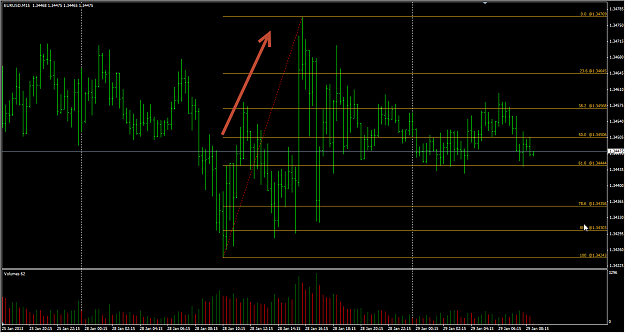
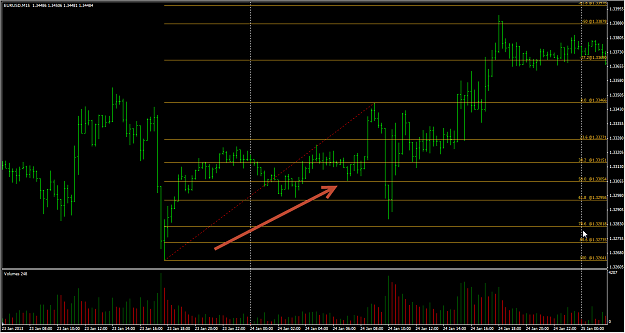
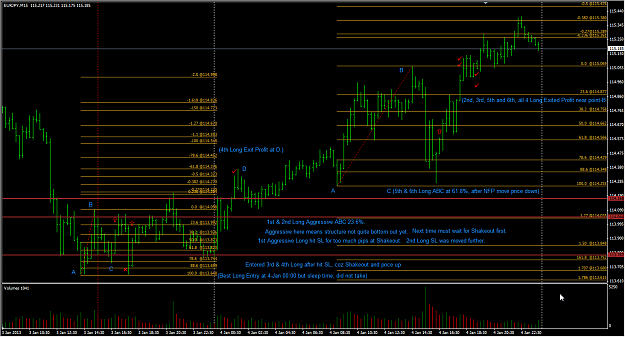
- foxybunny replied Jan 31, 2013
The charts below are for my Long campaign on E/U M15 on 29-Jan. These Charts also reflects what I meant in my above post. On 28-Jan the Main Swing is Up. Wait for Down retracement on 29-Jan, that entered into 78% and 88% zone. Waited for further ...
Ratios & Harmonics: a Different Way to Trade
- foxybunny replied Jan 31, 2013
Now got Ninja Trader to work with MBT Demo. Noticed that Volume spikes on MBT Demo from "Thousands" to suddenly "Millions", unsure if this is normal. The Volume does not seem to give a general flow for MBT Demo. As E/U been in strong uptrend on ...
Ratios & Harmonics: a Different Way to Trade
- foxybunny replied Jan 30, 2013
Thanks Damien1881, Starry & dibo90 on the NinjaTrader. I just opened up MBT demo for forex and downloaded "MBT Desktop Pro". Attached is a screen shot showing EUR/USD at 60ticks. It does NOT look like Ninja Trader, and it has only pre-selected ...
Ratios & Harmonics: a Different Way to Trade
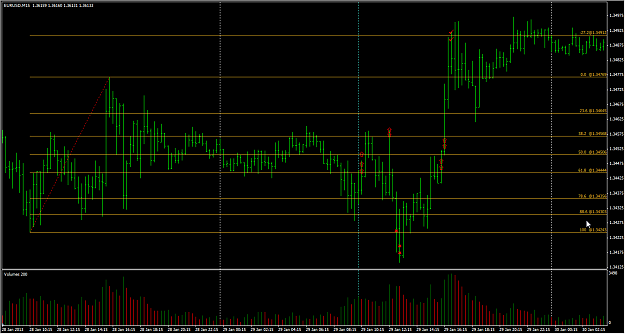
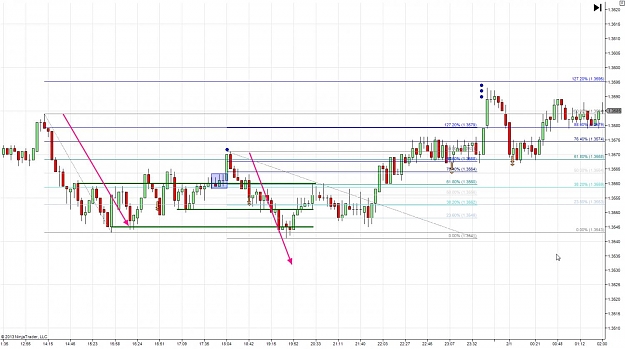
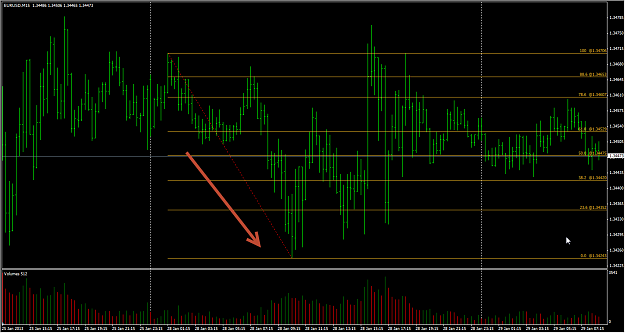
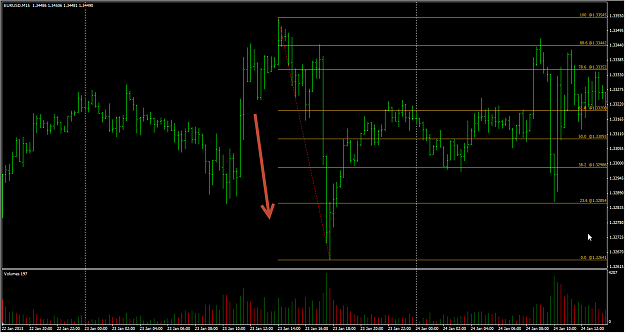
- foxybunny replied Jan 29, 2013
I am showing the Main Swings only on EUR/USD M15 for 28-Jan-13. There are 2 Main Swings identified for this day. image image
Ratios & Harmonics: a Different Way to Trade
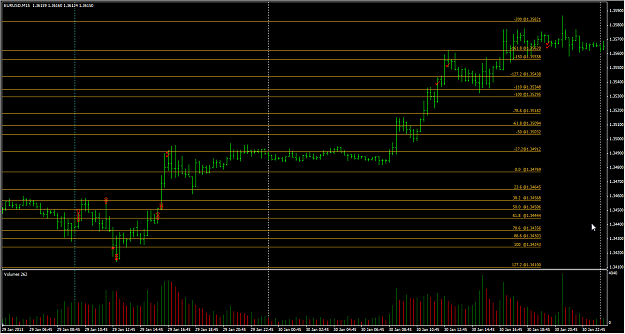
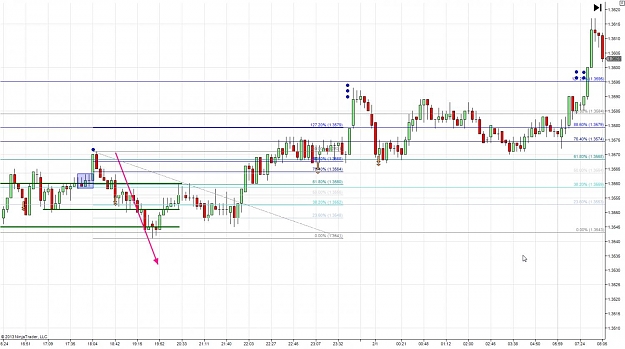
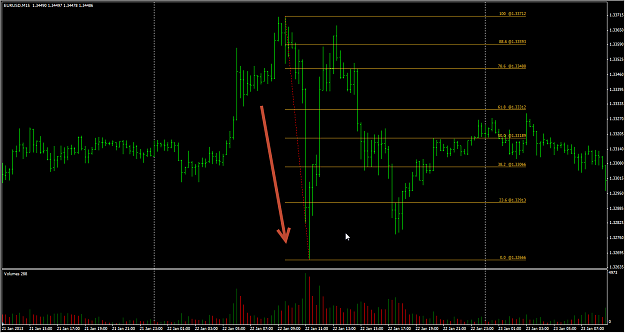
- foxybunny replied Jan 29, 2013
I am showing the Main Swings only on EUR/USD M15 from 22-Jan-13 till 25-Jan-13. I am NOT showing or using Tick Charts as don't have easy access to them on the MT4 platform. I don't want to show or use Dominant Swing, which are basically just ...
Ratios & Harmonics: a Different Way to Trade
- foxybunny replied Jan 14, 2013
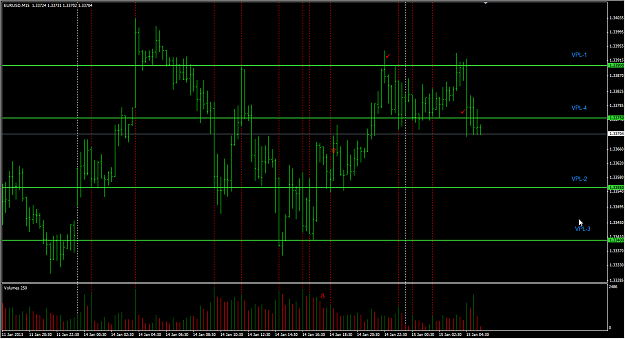
Hi Spudfyre, Thank you very much for your sharing of this brilliant method, and with showing full explanations on all the individual bars on the charts. I used some form of VSA understanding normally, and usually applies my Price Levels only to the ...
Volume Price Level Trading
- foxybunny replied Jan 6, 2013
Since you put up the EUR/USD-D1 chart, this is how I see the structures for D1 for now. Some combinations for fun.
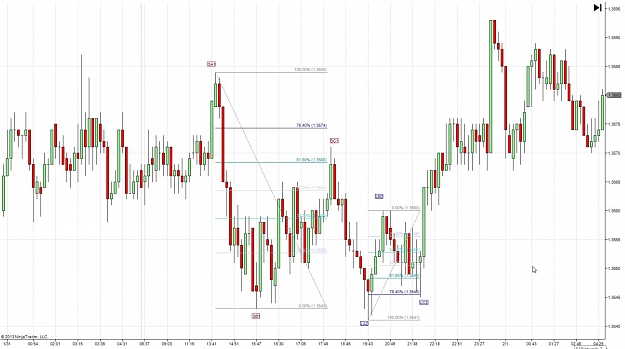
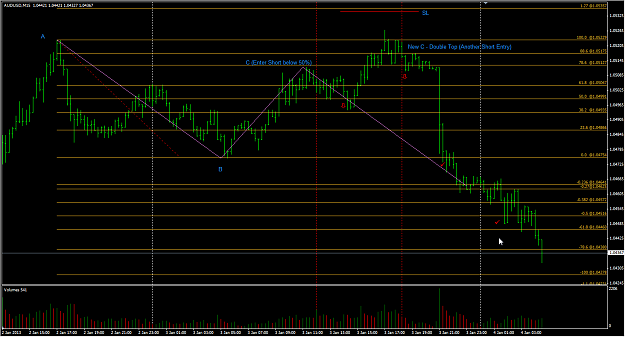
Ratios & Harmonics: a Different Way to Trade Chart 1 - Bear Butterfly Chart 2 - Bear Rectangle ABCDE Chart 3 - Possible Bearish-ABC Short. If C? does goes well above A, then ...
- foxybunny replied Jan 5, 2013
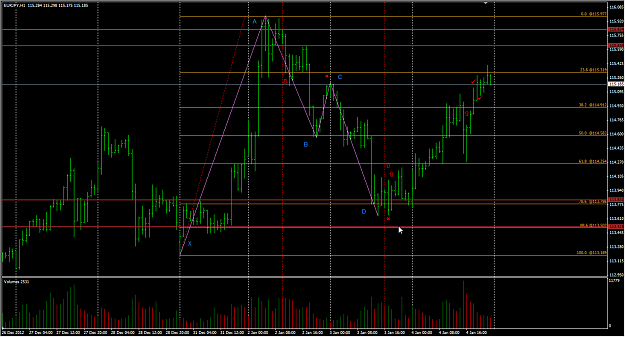
Some XABCD(Gartley) and AB=CD patterns for EUR/JPY both Short and Long. 1st Chart => EUR/JPY, H1 gave the clearer overall picture of reversal at Gartley (X-ABCD) for a Long on 3-Jan. 2nd Chart => E/J M15. First 2-Jan, was a Short from ABC-pattern, ...
Ratios & Harmonics: a Different Way to Trade
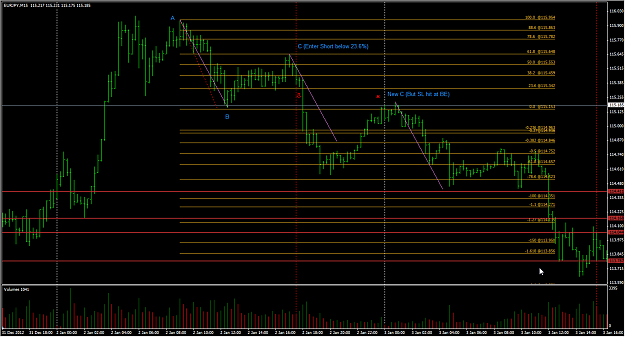
- foxybunny replied Jan 3, 2013
My last edit above showed that my original ABC pattern was invalidated as the price went up to point-A. My original SL was around point-A, and it would have been hit if I did not move this SL higher. However, I also mentioned above post that "the ...
Ratios & Harmonics: a Different Way to Trade
- foxybunny replied Jan 3, 2013
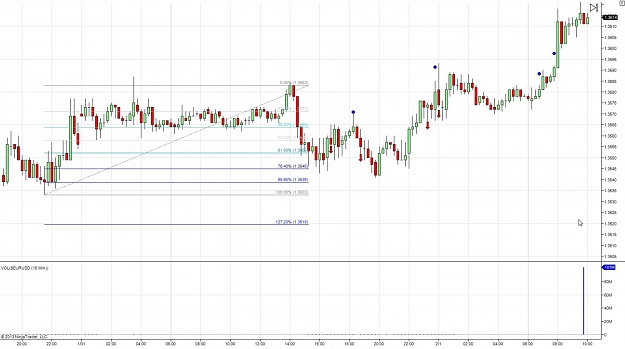
See if this Short works for A/U on M15 for a ABC-Short. It has retraced to the 61.8% and 78.6% zone, and enter only pass the 50%. Only thing is that tonight a few Red USD News, and that the bounce away from the zone was not that clean on M15. <Edit> ...
Ratios & Harmonics: a Different Way to Trade
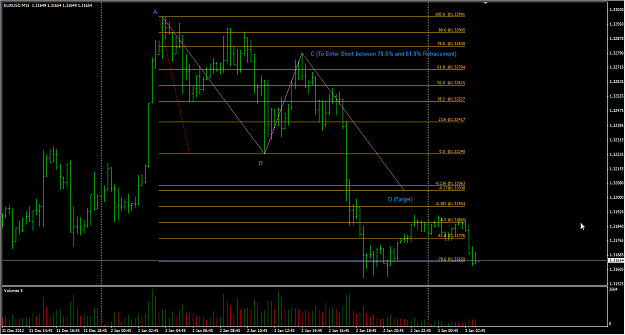
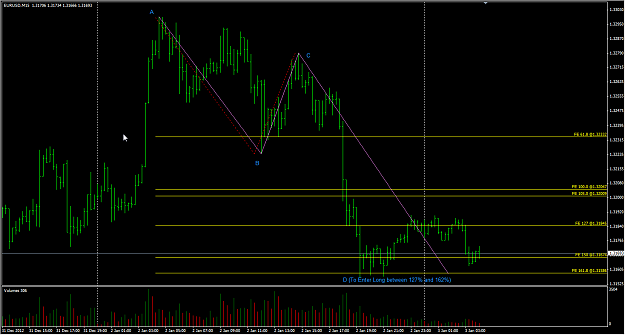
- foxybunny replied Jan 2, 2013
Mr. Pip, thank you for starting and contributing to this thread. On 2-Jan, E/U on M15 had a Short Entry at Point-C( retracement between 61.8% and 78.6%) . Also it had a potential Long Entry at Point-D between 127% and 162%. Curious is on how and ...
Ratios & Harmonics: a Different Way to Trade