- Search Forex Factory
- 13 Results
- comdoc replied Jan 23, 2009
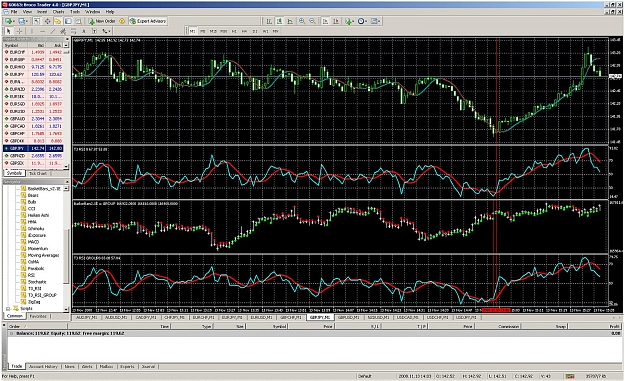
23Jan09 image — Good evening to all, Here's another screenshot attempt. Wish I had a Mac! Here's a great example of WAVES system. The vertical red line at 0252 shows overbought RSI divergence peak and cross. The trading entry is 3 candles ...
WAVES Heatmap system and EA
- comdoc replied Jan 11, 2009
12 Jan 09 Monday Sydney open — OK ferisoft... Here's a screen shot of week of 12 Jan 09 open. My wife captured the move in EURUSD pair for 21 pips profit. If trader was nimble, there was also a small GROUP trade possible. As you can see, ...
WAVES Heatmap system and EA

- comdoc replied Dec 15, 2008
Monday Market Offer — Hi all, Here's what the Sydney open (0100) looked like on 15 Dec 08. I could easily analyze this, but instead let's make it a learning experience. You tell me what you see in terms of WAVES indicators, and what your ...
WAVES Heatmap system and EA
- comdoc replied Dec 12, 2008
GROUP trade example — Hi everybody, Here's a GROUP live trade from 12Dec08 at 10:45. From top to bottom, note the MIDDLE condition on the 1M GBPJPY 3 time periods before entry: the candlesticks changed color and bodies became smaller. This ...
WAVES Heatmap system and EA
- comdoc replied Dec 2, 2008
Example single pair trade — Hi all, Here's another step-by-step example of single pair entry and exit, from 3Dec08@0028. Refer to yellow boxes on chart. From left to right, we note RSI peak divergence followed by RSI cross T3, over several ...
WAVES Heatmap system and EA
- comdoc replied Dec 1, 2008
Example — Hi again, Here's an example which could have been a GROUP trade: At 0627 GMT on 1 Dec. 2008 GBPJPY 1 minute chart. Elevated BasketBar from 0826 green to 0827 red. T3RSI crosses for GJ and GROUP. Open short on GBPJPY at 0827 at ...
WAVES Heatmap system and EA
- comdoc replied Dec 1, 2008
Forex Momentum — Merry rangebound day,
WAVES Heatmap system and EA The Momentum indicator that comes with MT4 platform doesn't help much for our WAVES trading purposes. So I've been experimenting. One sure sign of increasing momentum is when price breaks a small ...
- comdoc replied Nov 19, 2008
Single Currency vs. Currency Pair — 19Nov08.5:10 GBPJPY. Basket Bar color change to red. At 05:11 RSI peak above 70 in T3RSI and GROUP T3RSI indicators. 05:12 TDI green line cross red line downward. 05:13 HA candle color change to red gives ...
WAVES Heatmap system and EA
- comdoc replied Nov 13, 2008
Single pair trade example — OK, Todd. Here's an example of GBPJPY buy entry from 13 Nov 2008 at 13:02 GMT. At 15:01 (server time), on the T3RSI GROUP indicator (at bottom), RSI peak in oversold region below 30 with BasketBar change of color ...
WAVES Heatmap system and EA
- comdoc replied Oct 31, 2008
WAVES scalping example — Happy Halloween! Here's a live account trading example from my wife. We had just returned, turned on trading computer one hour before New York open to see a trade setup in progress. The image is attached. She saw 5 ...
WAVES Heatmap system and EA
- comdoc replied Oct 25, 2008
WAVES template — OK, eagle. I've attached a simplified template file. And a new signal example without v1.14 indicator displayed, for clearer view. 24 October 2008 21:53 to 22:06, 80 pips profit in 13 minutes. Just 2 red lines: first for SHORT ...
WAVES Heatmap system and EA
- comdoc replied Oct 23, 2008
Screenshot example — Hi J, Surely. Which terms do you not understand? Are you new to forex trading? Any Heatmap simply shows relative currency pair trend strength. This one shows which currency pair made the most profit within a fixed ...
WAVES Heatmap system and EA
- comdoc replied Oct 19, 2008
Optimizing trade Entry conditions — Merry Sunday,
WAVES Heatmap system and EA Here's what I look for after checking HEATMAP for which pairs to trade. The most profitable entry is obtained immediately following a MIDDLE condition. An example would be a Doji candlestick ...
- Posts by Member Search: 'comdoc'