- Search Forex Factory
- 14 Results
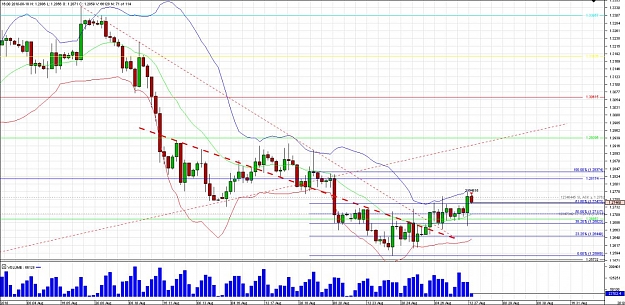
- Xismal replied Nov 15, 2010
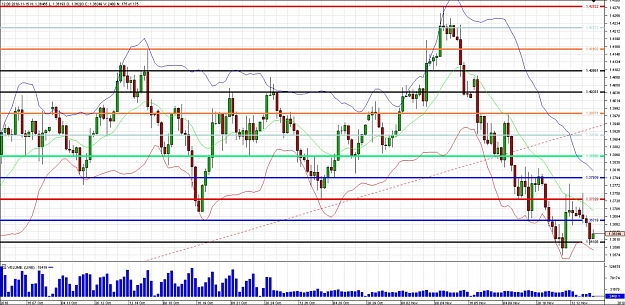
This was posted last Friday. Still seemed valid to me. Chart updated to show another rejection off the middle of the bollinger band on 4H timeframe. I missed the entry to short at 1.3733, was asleep plus it is a Monday (did not want to have an open ...
EURUSD
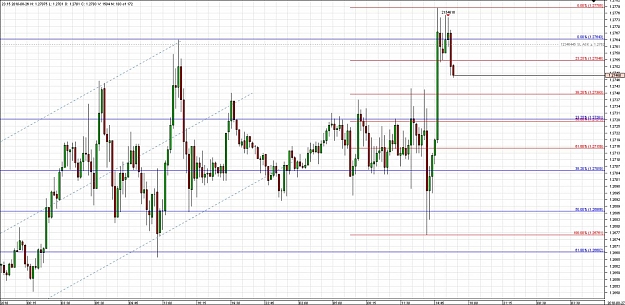
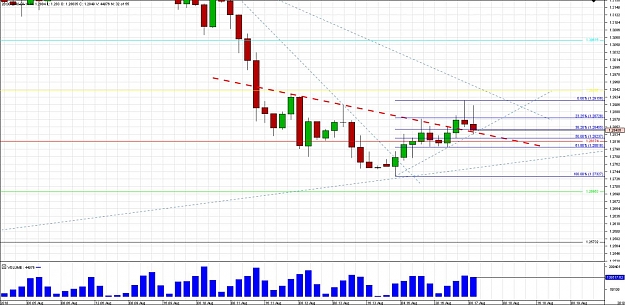
- Xismal replied Nov 12, 2010
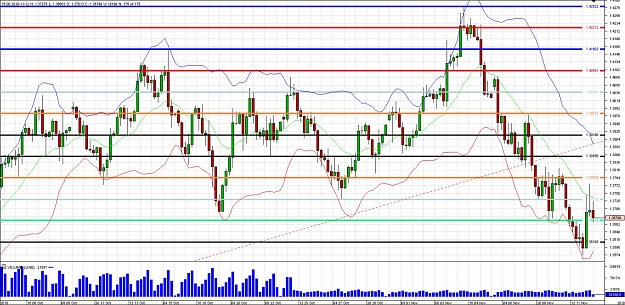
PA shows a rejection off the middle of the bollinger band on 4H TF, indicating further bearish momentum. Cracking 1.3671 opens up 1.3610 and today's low around 1.3596. Was not at my desk when the last 4H candle closed, else a short around 1.3721 ...
EURUSD
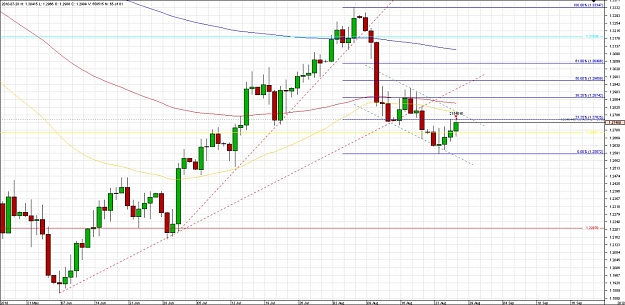
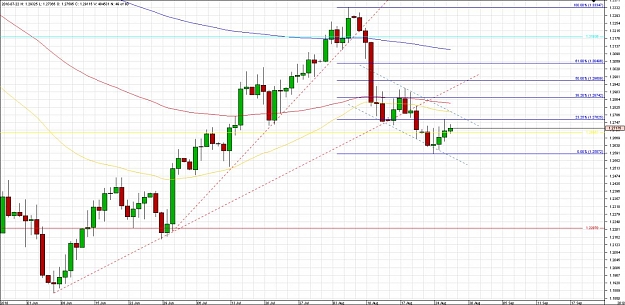
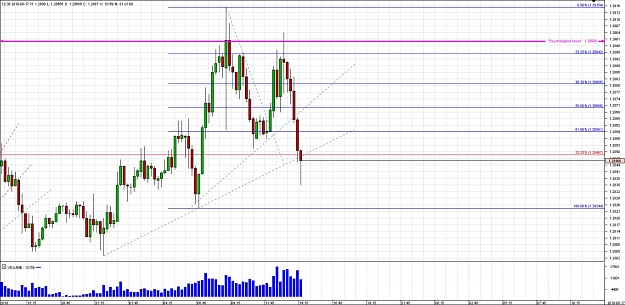
- Xismal replied Sep 17, 2010
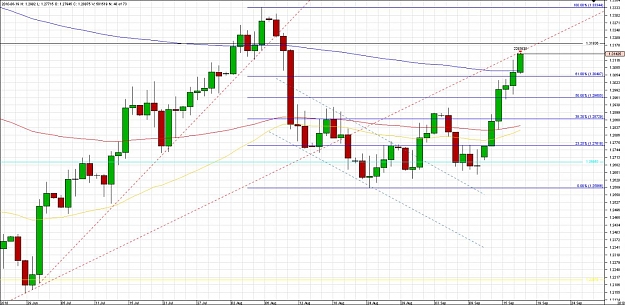
Longer term swing trade. Shorted: 1.3242 / Stop loss: 1.3360 / Take Profit: Around 1.2450 +/-
EURUSD
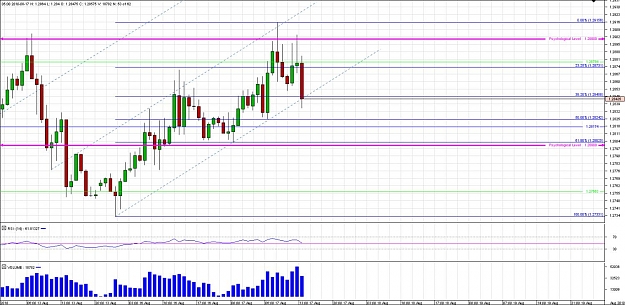
- Xismal replied Aug 31, 2010
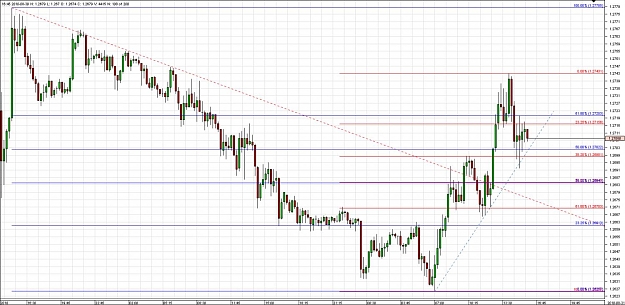
Topside: Watch break of 1.2720 for re-test of 1.2743 followed by a break of the latter level to test 1.2777/83. Downside: Watch break of 1.2698/95 followed by 1.2670. Long wicks up and down at current level. Short time frame, slight bullish tinge ...
EURUSD
- Xismal replied Aug 29, 2010
There are a few methods to make the kind of "few hundred pips move in a day" movement. One is real capital flow and even so, this requires ALOT of capital flow, usually meaning many Central Banks coordinating together to intervene and/or many huge ...
EURUSD
- Xismal replied Aug 27, 2010
Thanks Clash — Thanks for the advice. I set a TP at 1.2712. Seems a bit ambitious but my reasons for doing so: 1) 4HR timeframe, the middle bollinger band has acted as support for the past few bars. 2) I have a daily pivot around that level ...
EURUSD
- Xismal replied Aug 27, 2010
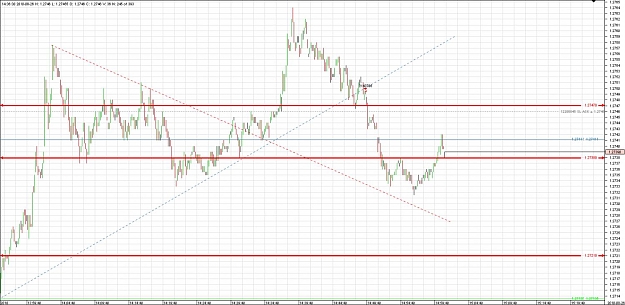
Shorted at R1 — Was busy trying to crop my screenshots and also removing some lines from my chart. Shorted at 1.27655, SL locked-in at 62 (BE +3.5) since this is a short-term counter-trend trade. TP yet to input, although 1.2748, 1.2728, ...
EURUSD

- Xismal replied Aug 27, 2010
Personally I think it would be healthier if this retrace to 1.2825 (maybe extend to 1.2875) before the bearish flag breaks for more momentum. I will start to re-think my bearish views once 1.2960 is reached and held.
EURUSD
- Xismal replied Aug 26, 2010
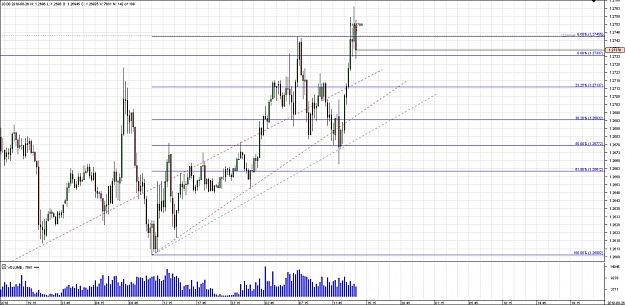
Shorted 1.2749.5 (break of upward trendline plus near 23.25% fibonnaci line (12 pips away) on daily timeframe). SL shifted to 46 pips as soon as 15 pips profit as this is a counter-trend trade. TP to decide on PA and what market gives.
EURUSD
- Xismal replied Aug 26, 2010
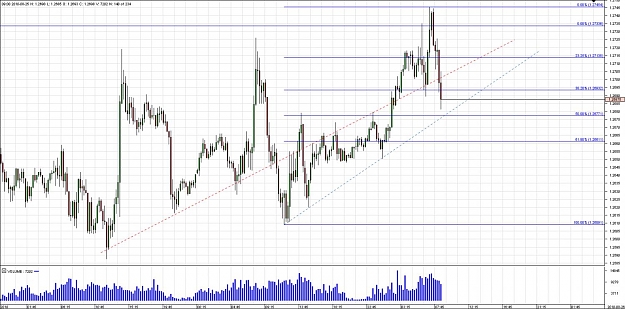
I got a potential bounce area at 1.2677 though, which also corresponds with a short timeframe 50% fibonnaci retracement from this short move up from yesterday. I am short-biased at the moment, so will probably take your advice and stay out.
EURUSD
- Xismal replied Aug 25, 2010
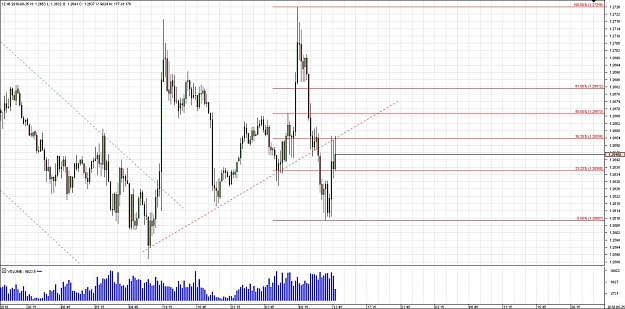
Minor trendline holding for now — Potential entry for short? Notice the 3 long upper shadow wicks. That and daily pivot occurs around that level. Maybe a small position size and build it up if it shoots up? Any comments would be appreciated.
EURUSD
- Xismal replied Aug 17, 2010
Good time to Buy / Long? — Hmm, I was expecting 43-49 to hold though, considering 100 moving average rest around that area. Wanted to buy here but bearish momentum seem strong. Unsure where a decent stop loss could be put if I go long here, so ...
EURUSD
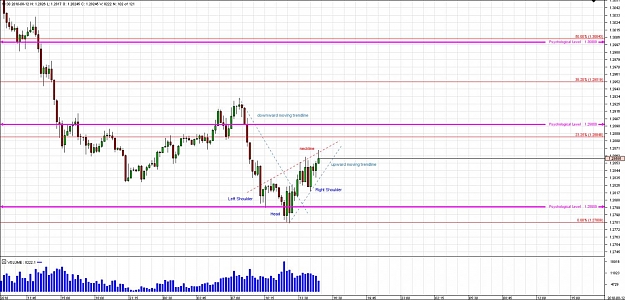
- Xismal replied Aug 12, 2010
Potential inverted head and shoulder on 15mins TF and lower? — As attached. Target 1.2900/1.2910. Some comments if my chart is drawn correctly would be most appreciated. Edit: edited screenshot by adding in comments
EURUSD
- Xismal replied Aug 5, 2010
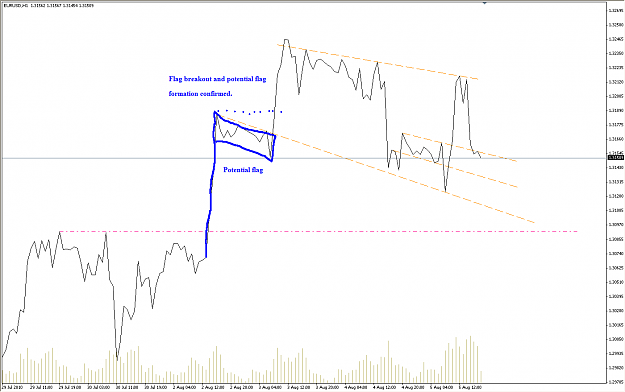
Flag — [quote=Pinero;3925468]that looks interesting, flag?? [quote] Just my opinion, but this looks more like a flag. Excuse my poor PS skills.
EURUSD
- Posts by Member Search: 'Xismal'