- Search Forex Factory
- 23 Results
-
 XNAdam replied Aug 13, 2017
I agree. A daily close on that BUOB above the short term trading range would, in my opinion, be a much stronger set up. The location of the pin bar could be better, though it is bouncing of some fairly established S/R and off the 1.2500 level. I ...
james16 Chart Thread
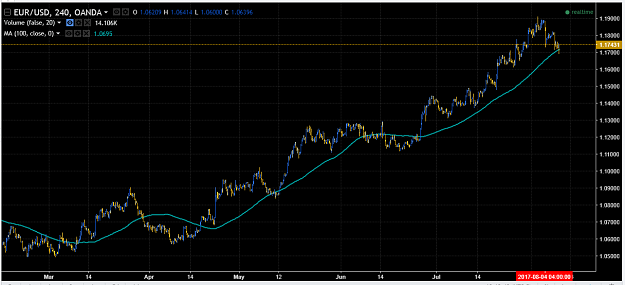
- XNAdam replied Aug 9, 2017
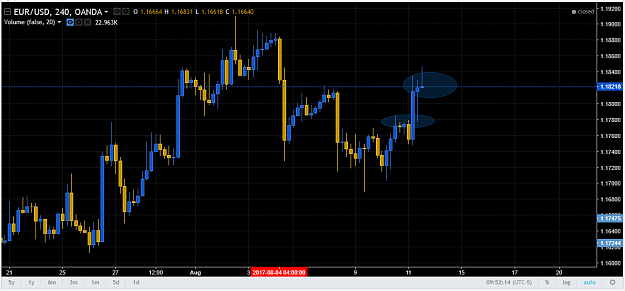
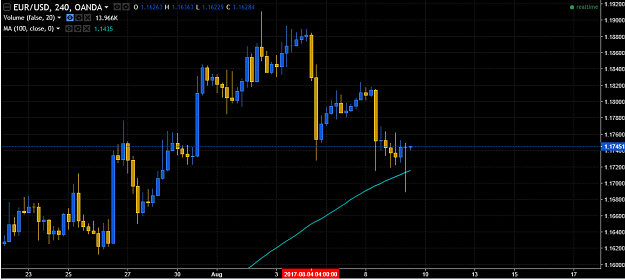
Nice looking pinbar on EU 4H. I would have liked to see it close a little above 1.1750, but it's a strong pin off 1.1700 and the 100MA, and we've been in an overall trend up, so there's a little bit of confluence. 1.1750 does seem to be a decent S/R ...
james16 Chart Thread
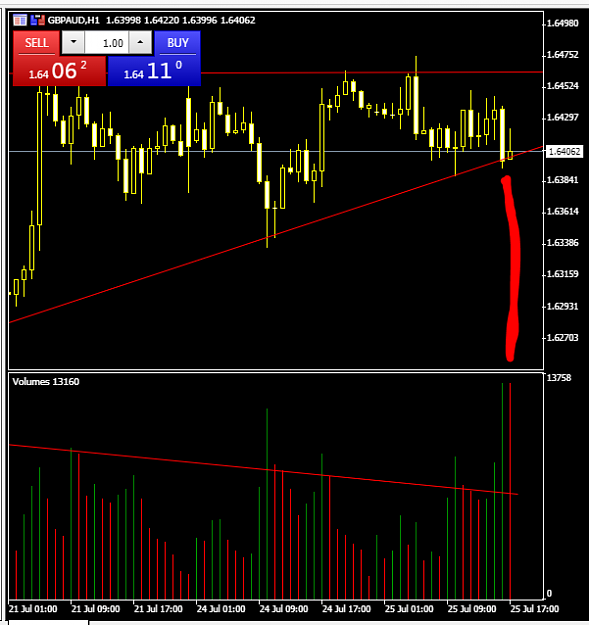
- XNAdam replied Jul 25, 2017
volume coming in again. still iffy on this pattern, given the location. prefer to see ascending triangles as continuations. if you're going to look for bullish entries, I would wait for a breakout to the top side and a retest of resistance turned ...
GBP/AUD, GBP/CAD, GBP/CHF and GBP/NZD thread
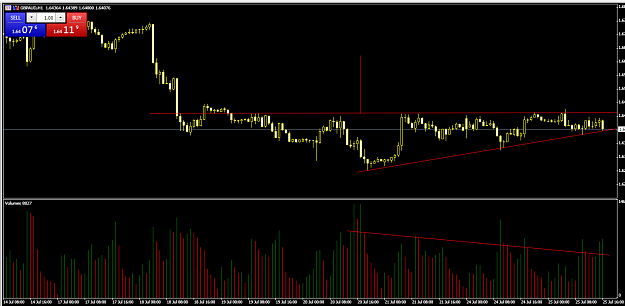
- XNAdam replied Jul 25, 2017
quick and dirty analysis, ascending triangle forming on lower time frames. looks solid enough. keep in mind we're still in downtrend overall on higher time frames. recently become a fan of this pair, looking forward to this thread.
GBP/AUD, GBP/CAD, GBP/CHF and GBP/NZD thread
- XNAdam replied Oct 16, 2014
Daily chart bullish pin. There's already been an up move on it, not sure how high it will go, just wanted to point it out.
GBP/JPY
- XNAdam replied Oct 14, 2014
just a bit of a different perspective. 6 week bar chart, bar ends at the end of this week. if price closes decisively below 168.00, I'm super bearish.
GBP/JPY
- XNAdam replied Oct 8, 2014
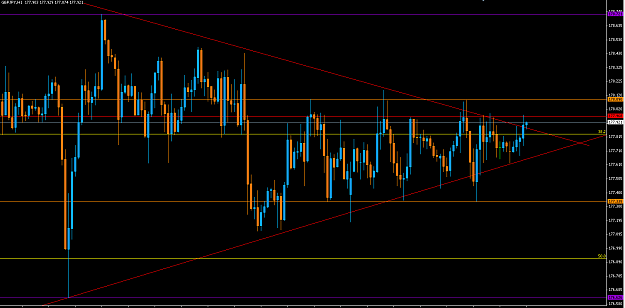
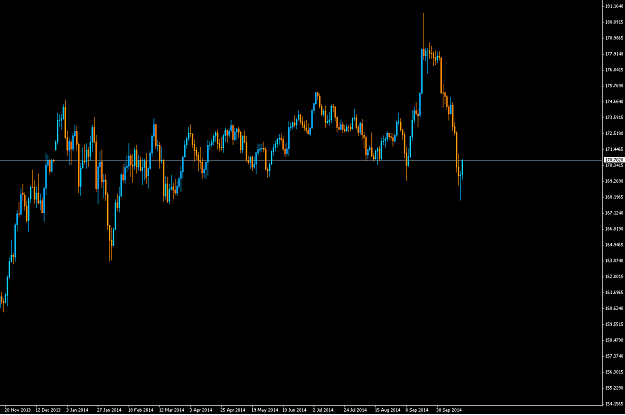
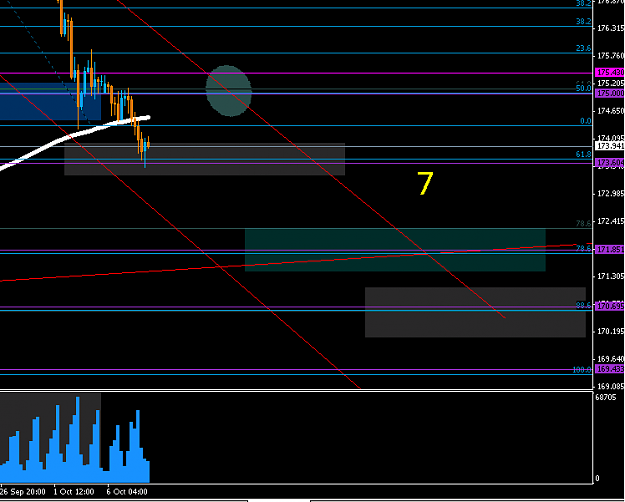
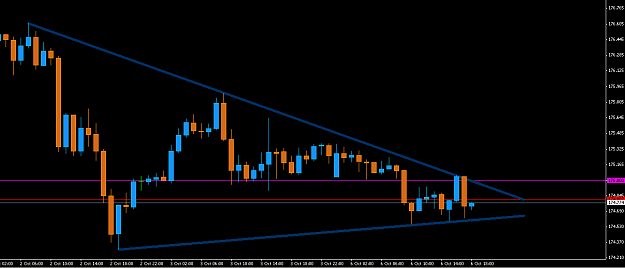
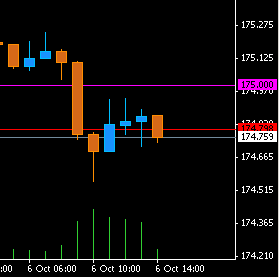
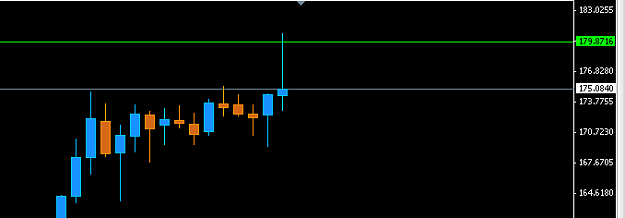
bit of late night analysis, back to normal H4 chart, as a small follow up from an earlier post. pinged off 173.60, and we've been hanging around 174 for a bit now. if we don't get significant movement down through the next couple sessions, I imagine ...
GBP/JPY
- XNAdam replied Oct 7, 2014
Then I also threw a 200 SMA on there for fun. I maybe possibly MIGHT have think about using it more for confluence. I keep getting surprised whenever I put it on a chart, lol.
GBP/JPY
- XNAdam replied Oct 7, 2014
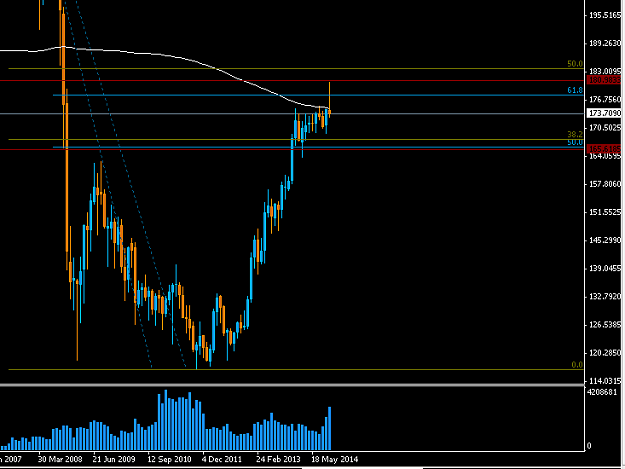
Context of the four week pin. Again, I'm not saying to place a short right now, but rather that I think this week's close will be significant in determining direction, as well as price reaction to 171.85 area, if by chance it ever gets there. The ...
GBP/JPY
- XNAdam replied Oct 7, 2014
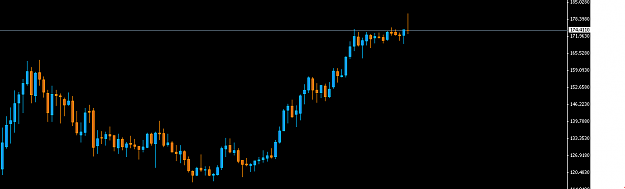
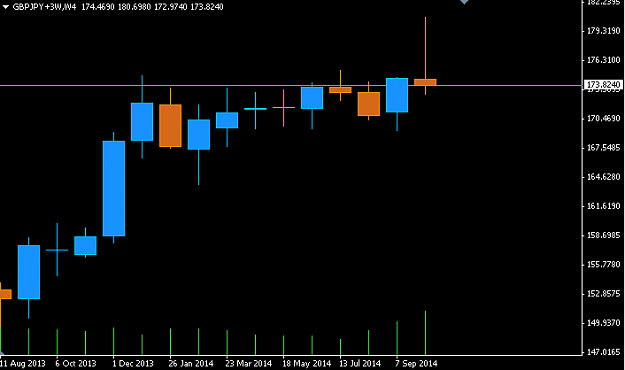
Well here's another way to look at it. Again, I look at non-standard time frames quite often. Here's a chart where each bar is four weeks. What is currently a giant month long pin bar, which is also a volume high going back two years, will close at ...
GBP/JPY
- XNAdam replied Oct 7, 2014
price dipped into my first area of interest. we'll see what price does here, but still bearish. Personally, I want to see definite price reaction to 171.85 area before I entertain long positions.
GBP/JPY
- XNAdam replied Oct 6, 2014
I'd have liked it to close a bit more down towards it's low, but I do like that sharp test and rejection. We'll see how it reacts if it gets down to 174.40. After that, my next areas of interest are 173.60 and 171.85.
GBP/JPY
- XNAdam replied Oct 6, 2014
Testing former support now resistance at 175.00. I'd like a sharp rejection.
GBP/JPY
- XNAdam replied Oct 6, 2014
Well, I have the close I was looking for. I will now be watching for opportunities to sell in the short term.
GBP/JPY
- XNAdam replied Oct 3, 2014
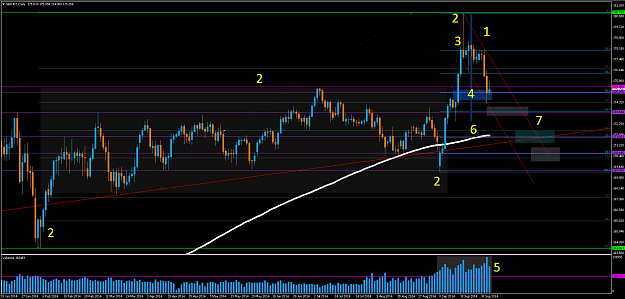
So remember how I said you don't want to see my analysis charts? Well, don't say I didn't warn you.
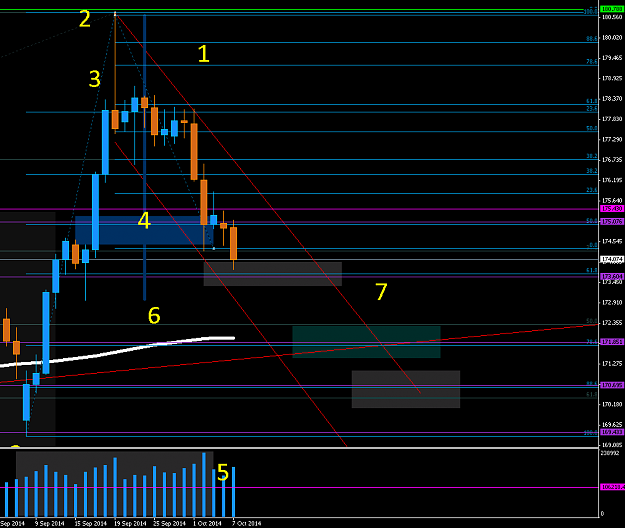
GBP/JPY Hopefully I can explain it well enough. Here goes. 1) I drew your channel on my chart, switched to D1, and zoomed out a bit. I wanted to get a ...
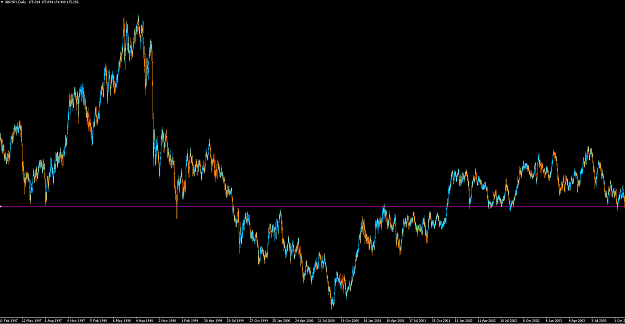
- XNAdam replied Oct 3, 2014
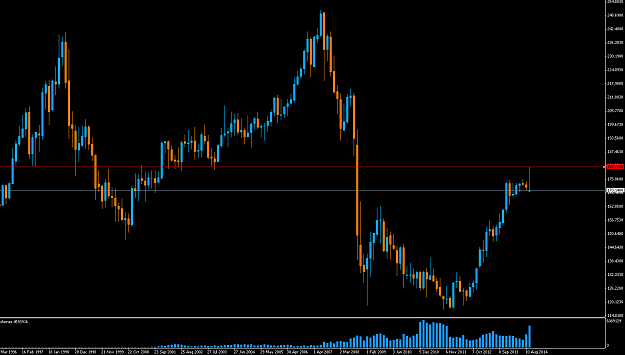
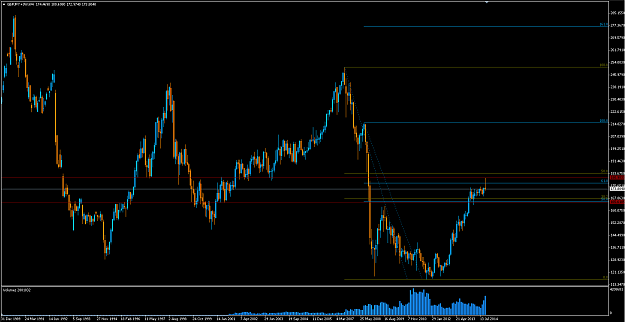
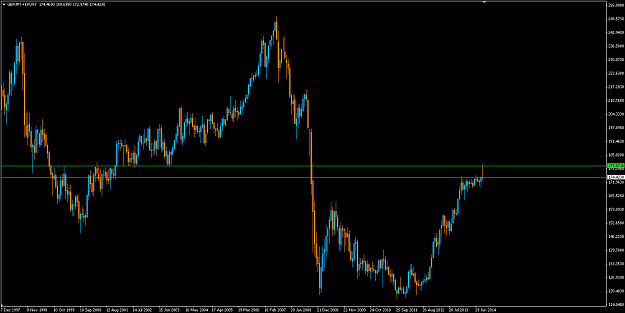
This is on a bit higher time frame. GBP/JPY, 3week bars bearish pin setting up, the bar closes end of day today. zoomed out a bit in the second pic to give you a view of major S/R levels (going back to '97!) of course, I'd like to see the candle ...
james16 Chart Thread

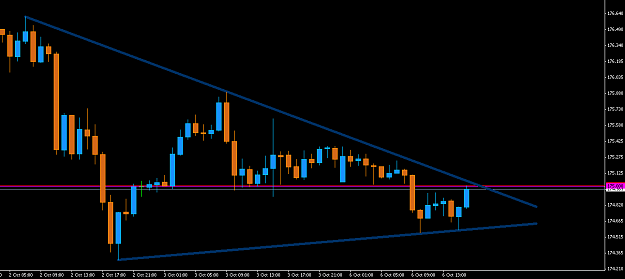
- XNAdam replied Oct 2, 2014
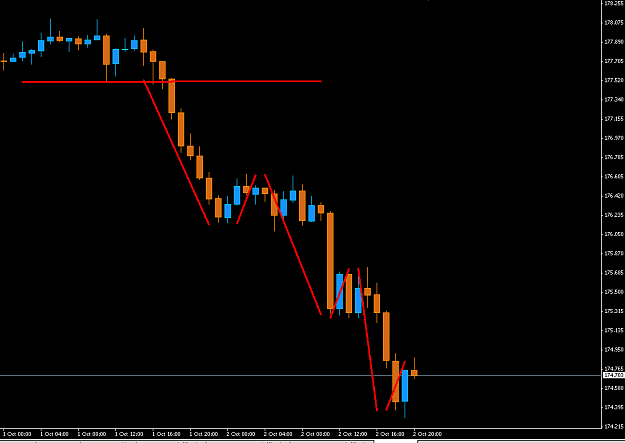
First chart is H1. - Each move down since breakout has been 130-ish pips, and each retracement has ranged for a bit after for 50-ish pips. - It will be interesting to see if this pattern holds for another break down. Second chart is H4 zoomed way ...
GBP/JPY
- XNAdam replied Oct 2, 2014
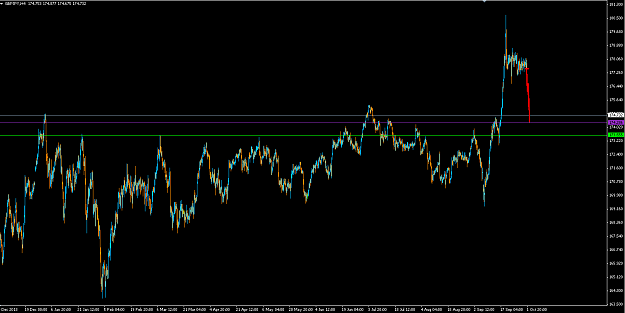
Here's a zoomed out cap of the same chart. This gives a better view of major S/R levels, as well as relative position of the soon-to-close bearish pin.
GBP/JPY
- XNAdam replied Oct 2, 2014
175 was hit! woo! so, I like to check out crazy non-standard time frames. I trade price action off S/R, so shifting time frames and the start of bar times helps me see price action in ways I wouldn't have otherwise. Take this screen cap, for ...
GBP/JPY