- Search Forex Factory
- 11 Results
- TrendDiscipl replied Mar 9, 2017
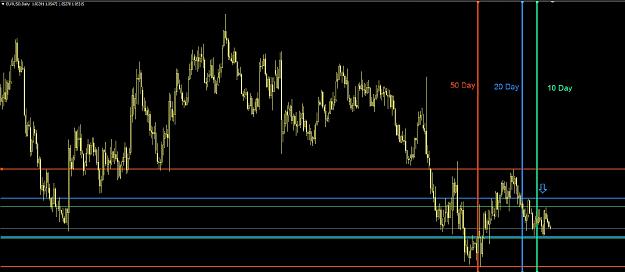
Me Again Forgot to mention that Arrow (buy or Sell signal) should be generated when price action touches the 50 or 20 day high (buy) or low(sell). Thank you
I will code your EAs and Indicators for no charge

- TrendDiscipl replied Mar 9, 2017
Hi Guys and Gals. Can someone please help me code an indicator that plots the last 10 days, 20 days and 50 days high and lows (these numbers should be variable so I can change them for different charts), also when price reaches 20 or 50 day high or ...
I will code your EAs and Indicators for no charge
- TrendDiscipl replied Apr 13, 2016
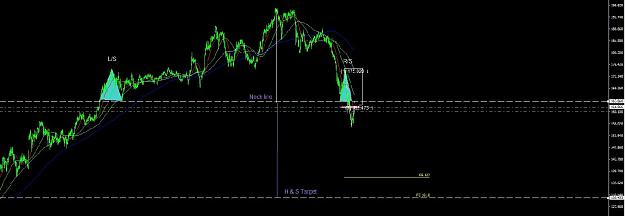
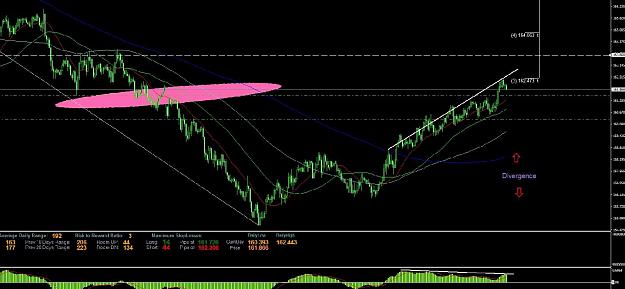
157 is the 50% fib of the last move down....so it could go there image
Dragon Riders GBP/JPY
- TrendDiscipl replied Mar 5, 2016
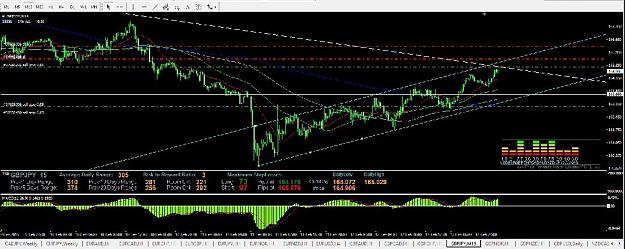
My long term and medium term analysis on the GBP/JPY Long Term: In the first chart I have highlighted a H & S Pattern On The Daily Chart which shows a target to the 130.00 - 131.00 area. This is also the 161.8 extension target of the last move down. ...
Forex Made Millionaire Thread for Blog Swing Trades
- TrendDiscipl replied Mar 1, 2016
]Hi Guys Here's my take on GPY/JPY in the medium term You see the pink dot on my chart...well that's a gap that needs to be filled, it also coincides with the .618 fib of the last major move down. I have placed a sell limit order here at 161.745. ...
Forex Made Millionaire Thread for Blog Swing Trades
- TrendDiscipl replied Feb 16, 2016
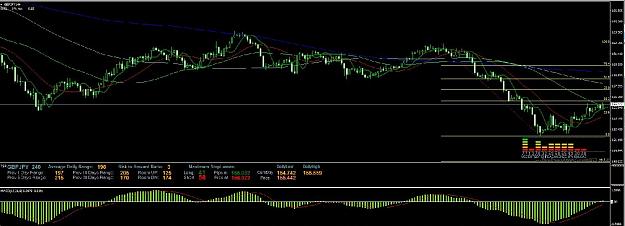
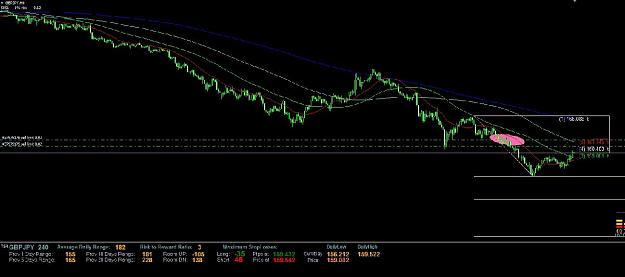
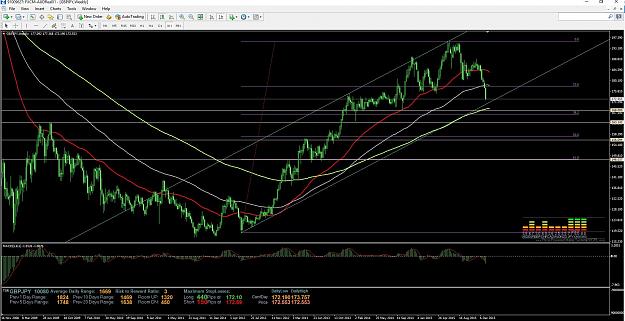
GPY/JPY May retrace to 163.65 area, as this is strong support turned resistance zone for this pair. Once price has retested this zone it should continue down to around 155.5 level. IMHO .Also Weekly 200 MA adds further resistance at current price I ...
Forex Made Millionaire Thread for Blog Swing Trades
- TrendDiscipl replied Feb 14, 2016
Hi Geppy Hope you were good to your wife.......Valentines Day and all
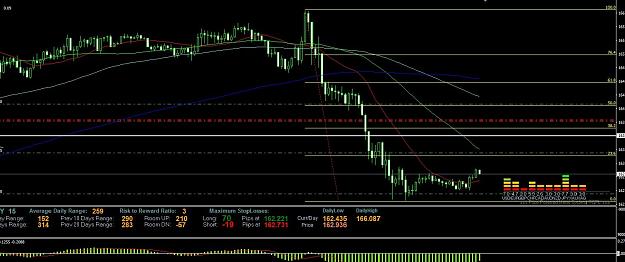
Forex Made Millionaire Thread for Blog Swing Trades Here is my chart for GBP/JPY I have a limit Sell order at 165.135 being the top of the channel and intersection of trend line with tight stop at 165.60. Then further ...
- TrendDiscipl replied Jan 8, 2016
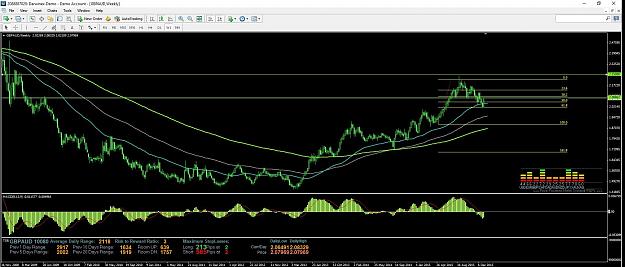
Just noticed that there's 2 GBP/AUD threads on FF I'm a trend follower, I don't use many indicators mainly EMA and get entries with Fibs and S&R lines. Heres my reading on G/A Pair is in up trend and uses the 50EMA line as Dynamic Resistance I just ...
GBP/AUD
- TrendDiscipl replied Jan 6, 2016
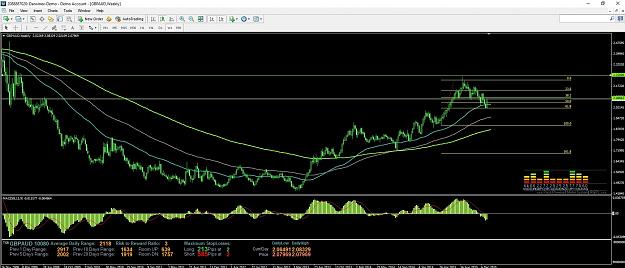
I'm a trend follower, I don't use many indicators mainly EMA and get entries with Fibs and S&R lines. Heres my reading on G/A Pair is in up trend and uses the 50EMA line as Dynamic Resistance I just went Long this pair, as you can see the PA has ...
GBP/AUD - Daily Trading
- TrendDiscipl replied Jan 6, 2016
Being a trend follower, Long term path is still up.........but I wont be getting Long this pair until around 168.00 area which is confluence of Fib (38.2) , strong support line (white) , long term trend line (blue) and 200 EMA (Yellow) on weekly ...
Dragon Riders GBP/JPY
- Posts by Member Search: 'TrendDiscipl'