- Search Forex Factory
- 21 Results
- Rafiki replied Mar 1, 2016
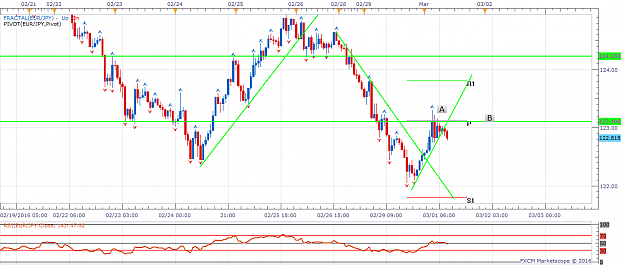
image Hello Landline and Daniel, This is my first attempt at drawing lines. First let me say that I believe that EUR/JPY is in a downtrend both monthly and weekly. So on the hourly chart keeping it simple the green horizontal lines represent ...
Two trendlines, ultimate reward
- Rafiki replied Mar 1, 2016
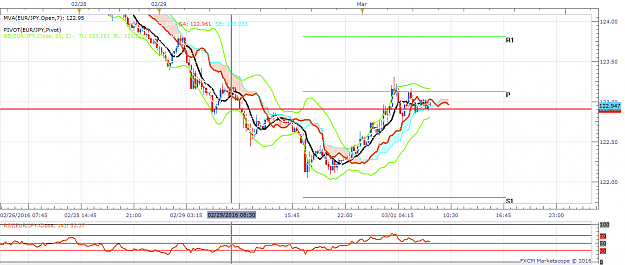
image Hello Daniel, I like your strategy of following two trend lines and while I follow Ichimoku and want to incorporate trend lines too I am encouraged to post here today. The thick red horizontal line represents the break I am looking for on ...
Two trendlines, ultimate reward
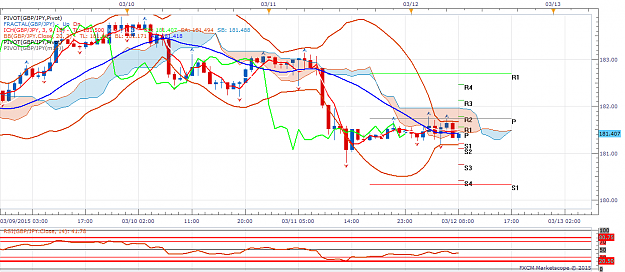
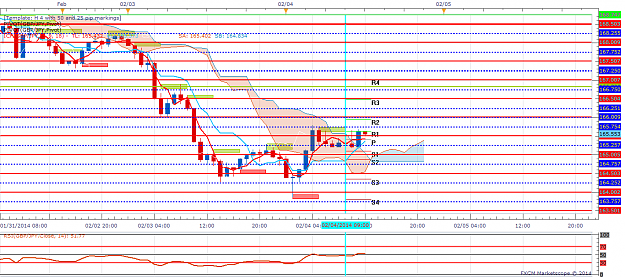
- Rafiki replied Mar 18, 2015
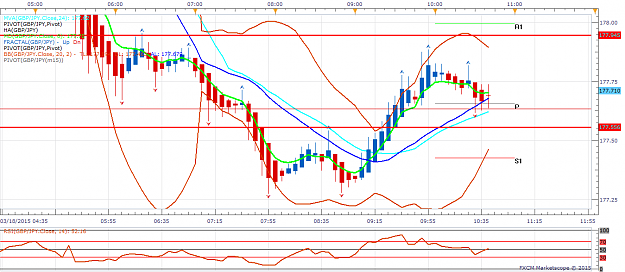
I have attached a 5 min chart , granted too short a time frame, however , I see this baby is bearish. If she crosses the horizontal line boundaries I have drawn I will according buy or sell with a 15 pip sL Expecting a drop to 176 ish area. I think ...
Dragon Riders GBP/JPY
- Rafiki replied Mar 12, 2015
Hello All, I have been sitting on the sidelines too long , time to share my thoughts. 180.50 taken out, next stop 180.40?
Dragon Riders GBP/JPY
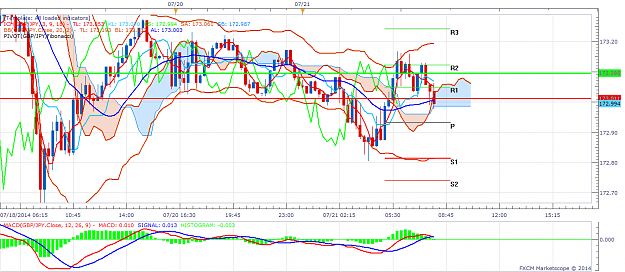
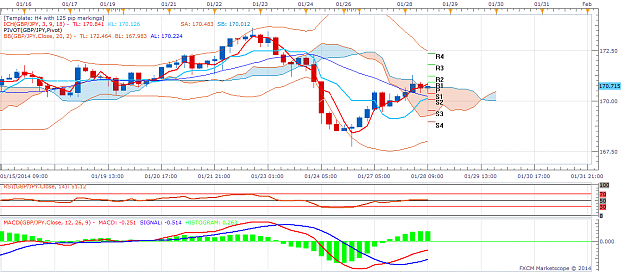
- Rafiki replied Jul 21, 2014
Hello All, I have posted a current 15 min chart. My analysis is as follows: Weekly is bearish , daily has just gone bearish, however H 4 is bullish and the next candle closes 9 am Eastern time. Should this H4 close below 173 we can expect 172.50 and ...
Ichimoku forever
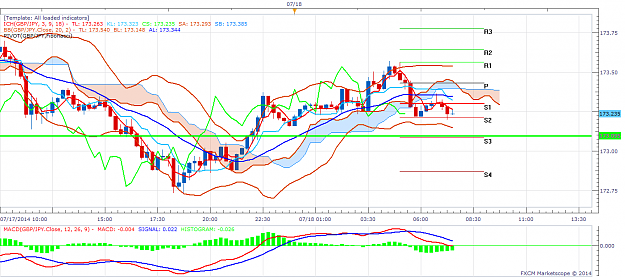
- Rafiki replied Jul 18, 2014
GBP JPY Hello All, I am posting here after a very long time, still consider myself a novice. I follow Ichimoku with different settings and I have posted a 15 min chart here. I see the weekly candle is bearish , so is the Daily and H4 candle rejected ...
Ichimoku forever
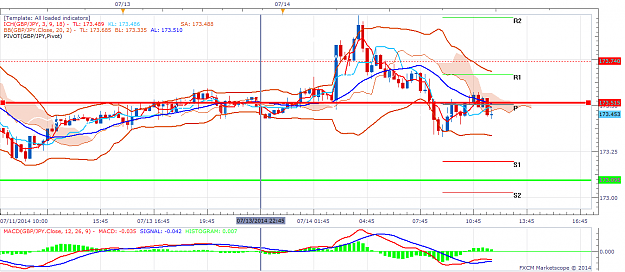
- Rafiki replied Jul 14, 2014
Hello All, This is probably the second time I have posted here, I have not posted for a while. This is my 15 min chart following Ichimoku. Last week's candle was bearish and this week has "almost" gone bearish I am expecting a drop to 173 sometime ...
Geppy's Geppy Thread (GBP/JPY)
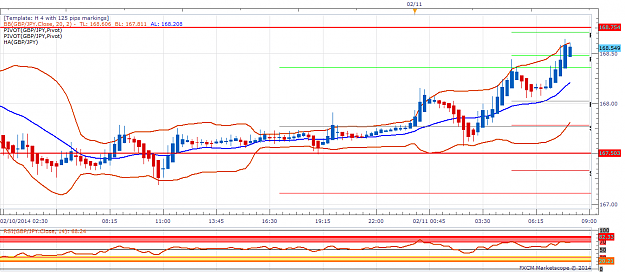
- Rafiki replied Feb 11, 2014
image Hello all, I have posted a 15 min chart with Heikin Ashi candlles over Bollinger Bands and find the charts quite interesting for short term traders. Does anyone here use these? If you know the direction of the trend this seems like an ...
Geppy's Geppy Thread (GBP/JPY)
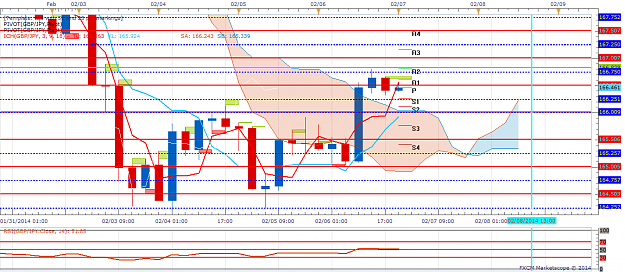
- Rafiki replied Feb 6, 2014
image I also believe we are heading to 167.50 /168.75 before we retrace.
Geppy's Geppy Thread (GBP/JPY)
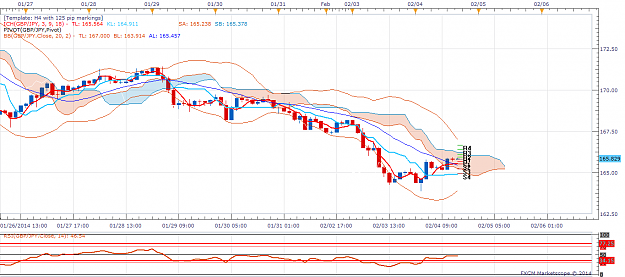
- Rafiki replied Feb 4, 2014
image H 2 chart attached, almost bullish, remember the key word is ALMOST. If it does the bullish run could continue to 167.50 It is the waiting game always.
Geppy's Geppy Thread (GBP/JPY)
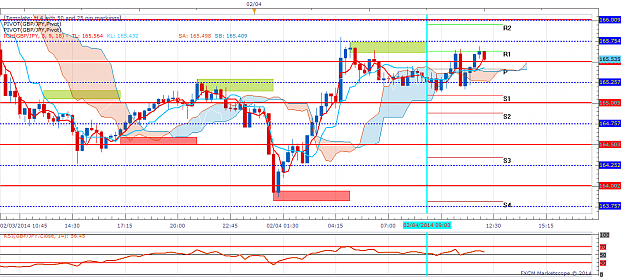
- Rafiki replied Feb 4, 2014
image image I have attached a I hr chart and a 15 min chart both bullish. My target 167.50.
Geppy's Geppy Thread (GBP/JPY)
- Rafiki replied Jan 28, 2014
image Hello all, I have been following this thread for a few days and have decided to post. I have attached a H 4 Ichimoku chart that tells me the Daily trend is going bullish, there is possibility of a retrace to the 169.50/ 170 area before she ...
Geppy's Geppy Thread (GBP/JPY)
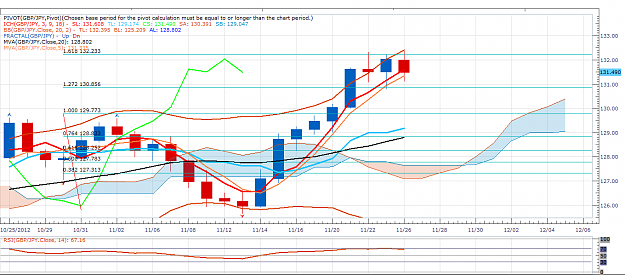
- Rafiki replied Nov 26, 2012
Skillwill, image GBP/JPY Thank you for your always thorough, easy to understand analysis. I am a short term trader but am beginning to see the benefits of longer term trading. Following Articulate's teaching this is definitely a time to wait. I ...
The perfect trading system
- Rafiki replied Nov 14, 2012
Last Post: Nov 14, 2012 6:18pm (2 hr 9 min ago) image Mr.chia Member Member Since Oct 2011 175 Posts AUDUSD, i have 2 decision 1.If audusd touch 1.0300, i will sell , because breakout 2 pin bar weekly candle before/support. 2.look like this week ...
The perfect trading system
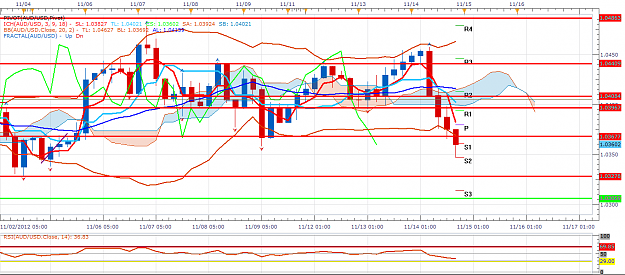
- Rafiki replied Nov 13, 2012
Nov 12, 2012 1:20pm (19 hr ago) image Mr.chia Member Member Since Oct 2011 172 Posts Quote: Originally Posted by Rafiki image AUD USD Mr Chia, What do you think AUD USD is at present, do you think it can break 440? Post hidden because Rafiki is ...
The perfect trading system
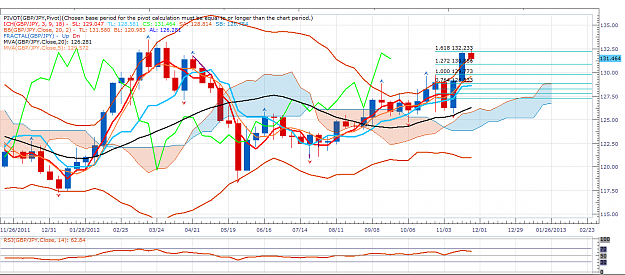
- Rafiki replied Nov 3, 2012
GBP JPY Going forward — image image Hello All, Articulate, Thank you for your excellent analysis, it is from reading this thread that my confidence is growing. I feel I want to participate more , more importantly I feel more confident to ...
The perfect trading system
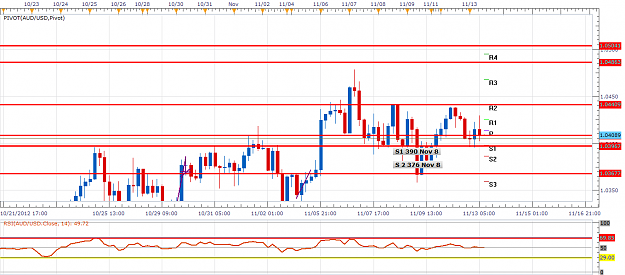
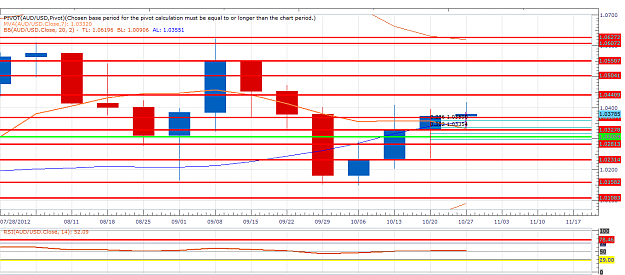
- Rafiki replied Nov 2, 2012
AUD USD — Mr Chia, image I have attached a weekly chart of AUD USD , the lines represent the weekly openings and closings. Based on what I see I have sold @ 1.0390. I believe this is heading down to at least the next support at 0327 and the ...
The perfect trading system
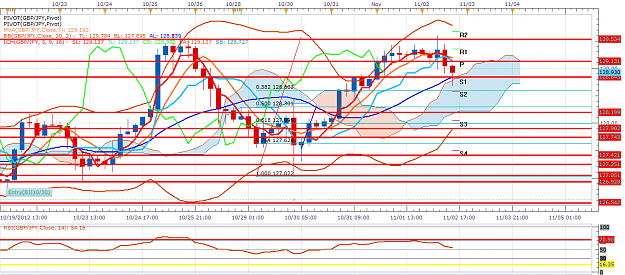
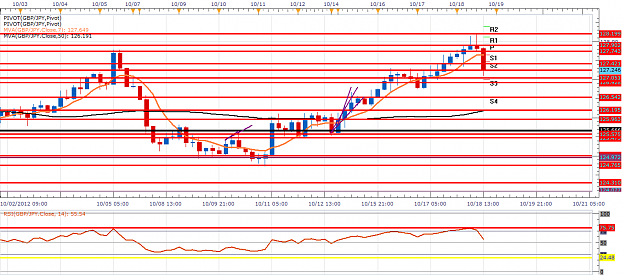
- Rafiki replied Oct 18, 2012
GBP JPY 4 hr trading — image Hello Articulate, I have attached a 4 hr chart of GBP/JPY. I would like to know if this pair would go up past 128.19.in the next few days Thank you.
The perfect trading system
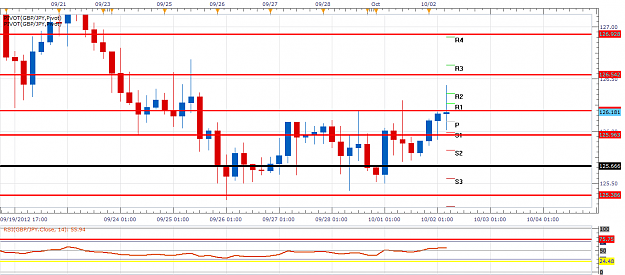
- Rafiki replied Oct 2, 2012
Monthly update chart - GBP/JPY — Hello Articulate, Thank you for posting the monthly charts. I am looking at the GBP/JPY chart and I have the following questions: 1. The yellow lines - Is this the 1000 pips movement? 2. The blue lines - What ...
The perfect trading system
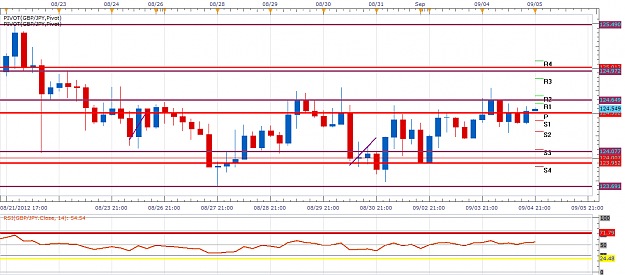
- Rafiki replied Sep 4, 2012
image Hello Articulate & Mr Chia, I have attached a 4 hr chart on the monster. The red lines represent every 50 pips, the purple lines represent the weekly pins - closing and opening. In the bottom window is the RSI. It is so clear now to ...
The perfect trading system