- Search Forex Factory
- 19 Results
-
 NoahEffect replied Dec 21, 2011
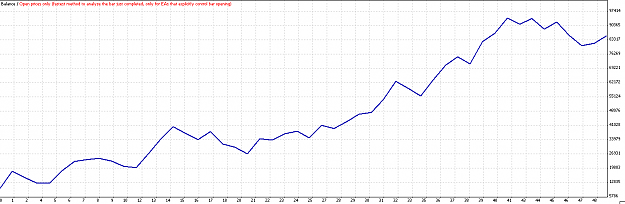
Here is a backtest for a simple EOD system which trades the daily EURUSD since inception till current on close/open prices. No compounding and a generic 10:1 leverage is applied. This simple system can trade with 3 max consecutive losers, with a ...
The DIBS Method... No Free Lunch continues
- NoahEffect replied May 18, 2011
Longer term model showing some EUR support in action. I would be looking to place some sell stops tomorrow during Hong Kong hours with an eye to entering on a break lower. No stoploss in mind yet, I will probably wait for obvious resistance to build ...
GU, GJ and EU Analysis Thread
- NoahEffect replied May 17, 2011
Hi everyone, Haven't been posting much because I have been working on a few short-term trend independent trading setups and their testing has taken some of my time. Nothing new or fancy, just tacking a few well known concepts together so we can take ...
GU, GJ and EU Analysis Thread
- NoahEffect replied May 4, 2011
Not discussing rumours of intervention specifically smikester, rather data released by the BoJ themselves regarding monetary aggregates and similar. Regarding the daily trend reversing, I guess that is a matter of interpretation
GU, GJ and EU Analysis Thread The entry method ...
- NoahEffect replied May 4, 2011
Good evening folks. Anyone watching the USDJPY? A few people have noticed that as of yesterday we have run a 50% retracement of the BoJ intervention from 76.5-85.5. I can't say that the chart is looking especially promising here for USDJPY bulls, ...
GU, GJ and EU Analysis Thread
- NoahEffect replied Apr 28, 2011
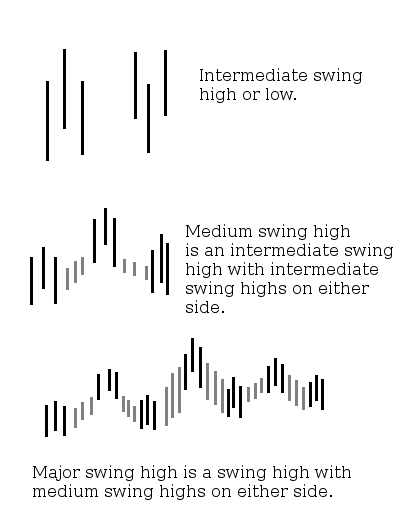
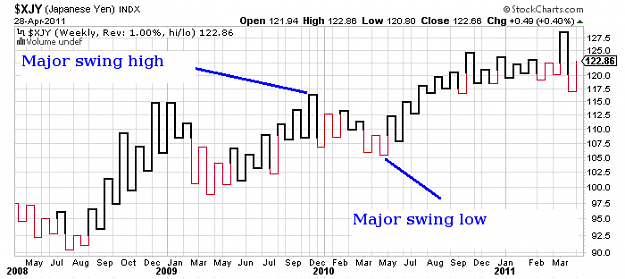
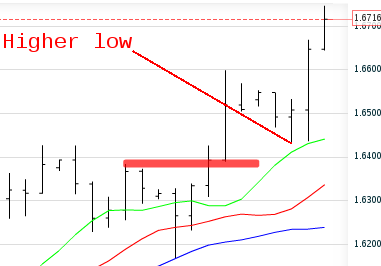
Hi smikester, I will show you what I meant. Let's go back to school for a minute. You probably know this (I just threw it together in paint): image But the problem with the above, in my eyes personally, was always the time factor involved. A swing ...
GU, GJ and EU Analysis Thread
- NoahEffect replied Apr 28, 2011
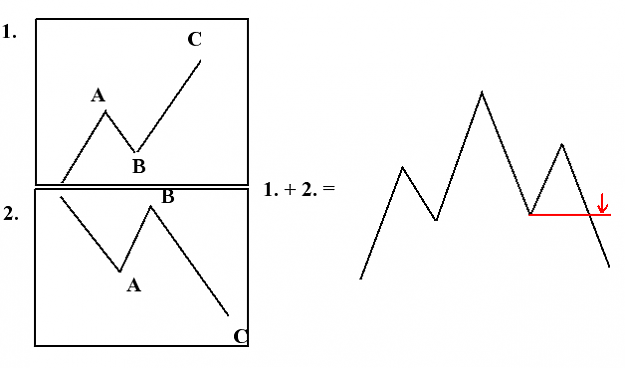
Can you show some examples? I am having trouble visualising it. To me a head and shoulders is just another way to say "trying to catch the breakout of a proposed first lower high or higher low. A-B-C up, A-B-C down. I just drew this example in paint ...
GU, GJ and EU Analysis Thread
- NoahEffect replied Apr 28, 2011
Hi 45Condor, I do not agree that the chart you posted is of the pattern you posted. Bulkowski lays it out proper as always: url Just out of curiousity, why must they be trailed? They are, but not using any moving average or similar "derivative of ...
GU, GJ and EU Analysis Thread
- NoahEffect replied Apr 26, 2011
Hello everyone, I thought I would join in on this lovely thread after a discussion with a friend who goes by the handle of sinner on this forum. We are two buddies from way back, he was my intro and guide into the markets a few years later. We spoke ...
GU, GJ and EU Analysis Thread
- NoahEffect replied Nov 1, 2010
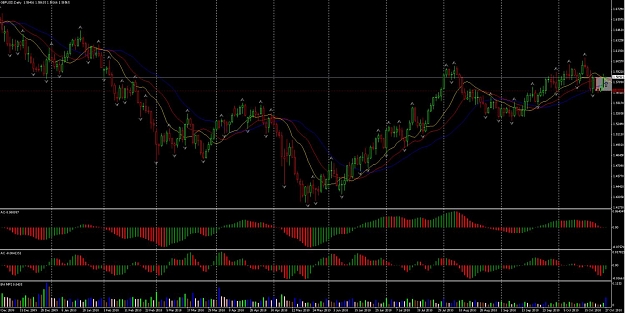
Hi guys, hope everyone is well today and taking the good trades. A relatively strong close into the week for cable, but in my view not a lot of buying interest on Friday (probably more like month end contract settlements and similar things caused ...
Cable Update (GBPUSD)
- NoahEffect replied Oct 29, 2010
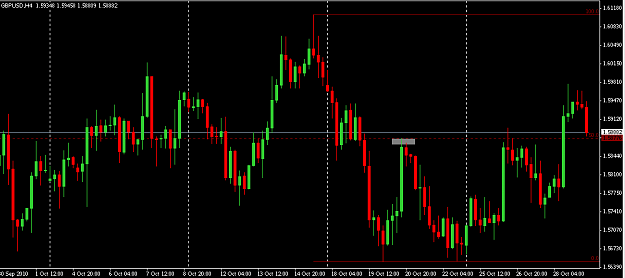
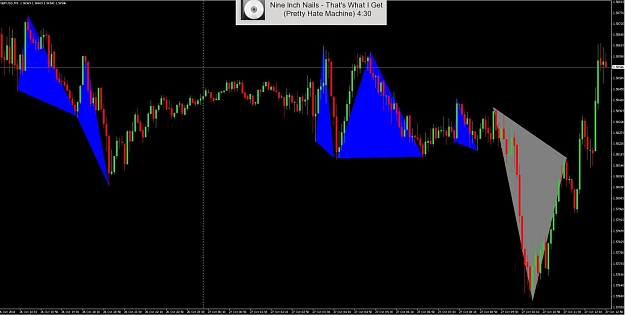
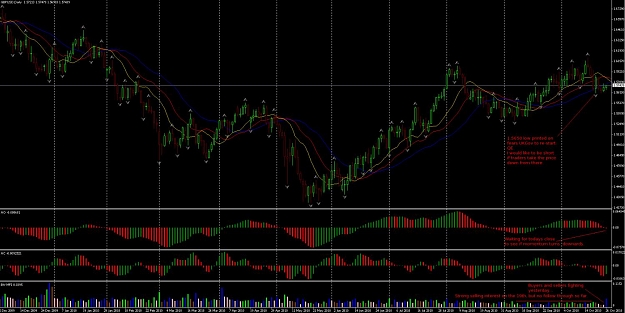
I am viewing the 50% retrace shown below and the specific high in the grey rectangle as a strong zone of interest to both bulls and bears. If we break back below it would be a seriously bearish move I feel.
Cable Update (GBPUSD)
- NoahEffect replied Oct 29, 2010
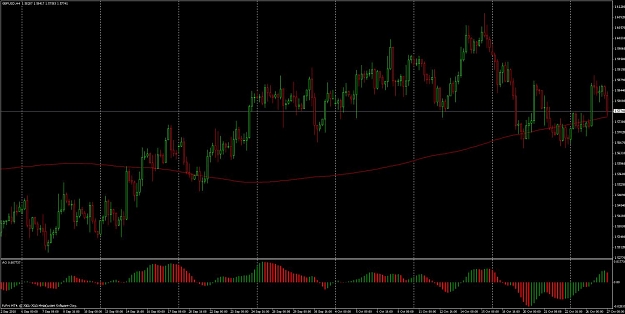
Hey kids! Thank Goodness it's FRIDAY! As above, still long. Up, by a tiny bit more
Cable Update (GBPUSD) Looks like some here take more trades in a day than I blink? Paint the tape boys and girls, I've placed two orders and had one fill this week hehe. New York closed ...
- NoahEffect replied Oct 28, 2010
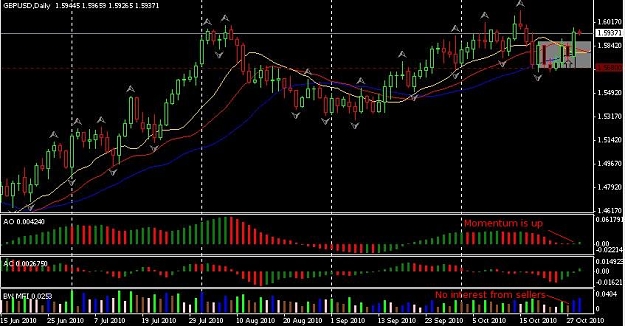
Still holding this posture. Up, by a tiny bit. AO just doesn't want to cross down below 0, so I am happy to hold onto the long for now. Yesterdays action painted as an inside bar, which we have now broken out of to the upside. Yesterdays low is now ...
Cable Update (GBPUSD)
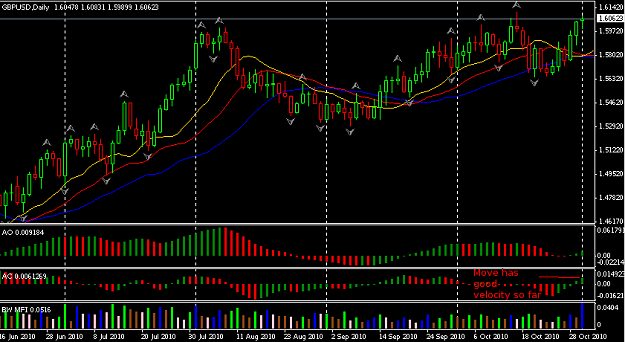
- NoahEffect replied Oct 27, 2010
The triangles highlight very clear supply patterns into yesterdays close and during the earlier market hours today. The fact that we are back into these levels should give bears some pause I think. Looks like a good old fashioned short squeeze is ...
Cable Update (GBPUSD)
- NoahEffect replied Oct 27, 2010
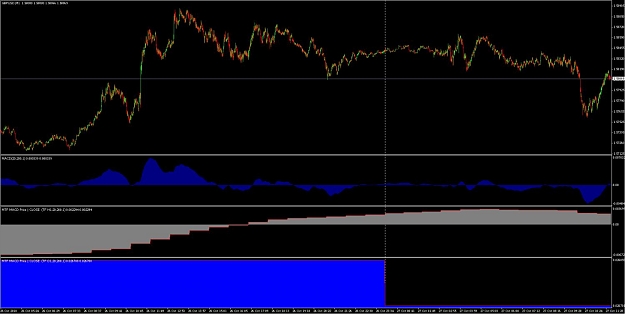
I plot it on the MACD (20,200,1 as you specify), looks good, as good as anything else anyway
Cable Update (GBPUSD) Shame MT4 doesn't allow SMA/EMA MACD to test what it looks like 24SMA/200EMA. But you get the idea. image As you say. See above! A lot of work! High ...
- NoahEffect replied Oct 27, 2010
Hey bbmac, Very interesting charts you have posted on the intraday plot. I see you use the 200SMA, it is a very bearish sloped fakeout move on the chart you posted, but when you look at the 4 hour intraday plot, the formation seems quite reversed ...
Cable Update (GBPUSD)
- NoahEffect replied Oct 27, 2010
Wow Eulogy, please don't laugh at me? Seems very rude. I was merely providing an example of chaotic price potential. Your own example of the DX reversing from 77 to 80 in an under an hour is in fact, exactly what I was trying to highlight. Price ...
Cable Update (GBPUSD)
- NoahEffect replied Oct 26, 2010
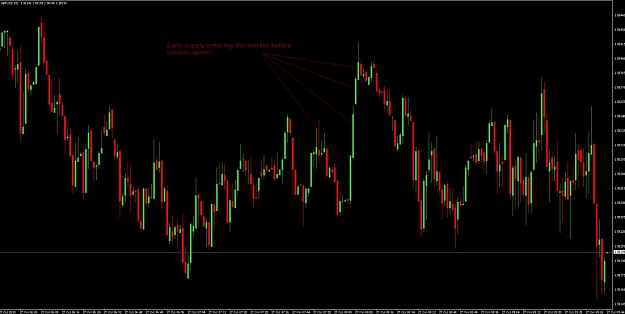
Hi guys I'm back for my second post! Seems the early market rumours about the UK GDP figures coming out better than expectations turned out to be true which drove the pair significantly higher overnight. A classic "Noah Effect" event! ( url ) I am ...
Cable Update (GBPUSD)
- NoahEffect replied Oct 26, 2010
Hi guys, New member to the forum here, hope to contribute my thoughts to this thread. Have been trading currency for some time now, cable is my favorite due to high correlation with EURUSD but with better price opportunities due to overall lower ...
Cable Update (GBPUSD)
- Posts by Member Search: 'NoahEffect'