- Search Forex Factory
- 13 Results (1 Thread , 12 Replies )
- Motish replied May 19, 2015
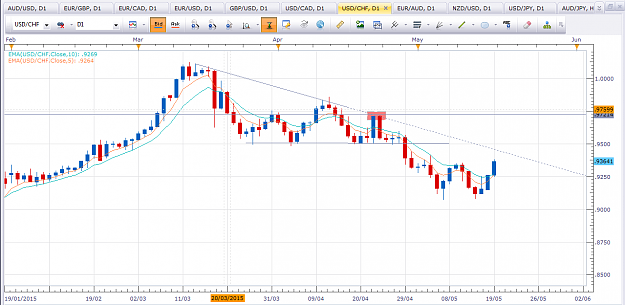
Lets keep an eye on USD/CHF this time I am going to enter only if it is A+ setup: * Short only * PA signal on confluence only - pin bar, DBHLC, etc. * Take position only around bearish resistance trend line - confluence should be there. image
Trade to the point
- Motish replied May 19, 2015
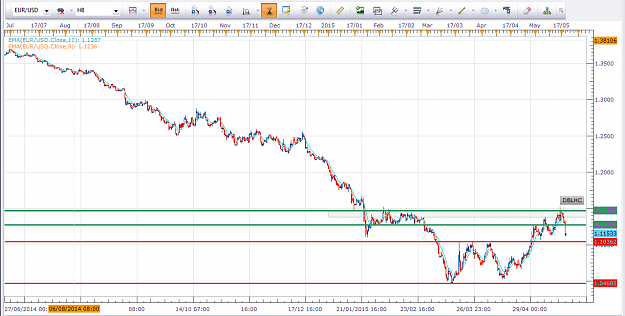
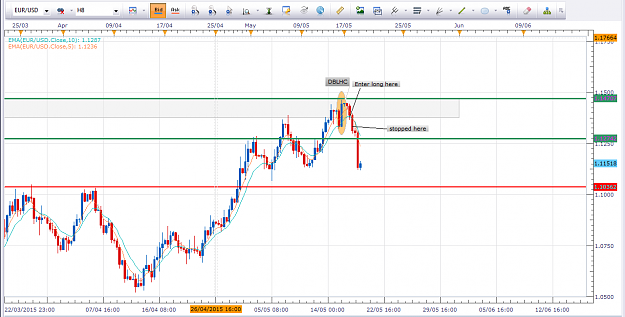
check out what wrote Jim on his James16 chart thread: url to bad I didn't read it before my last trade yesterday... That's an example of how not to trade DBLHC. right before a resistance, not checking larger time frame, 5 pips difference instead ...
Trade to the point
- Motish replied May 14, 2015
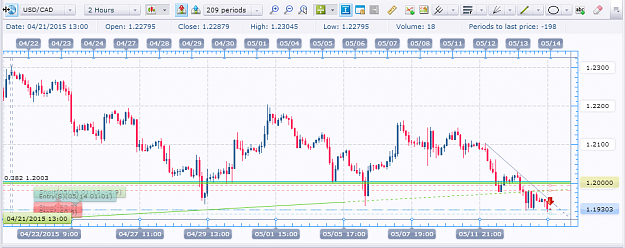
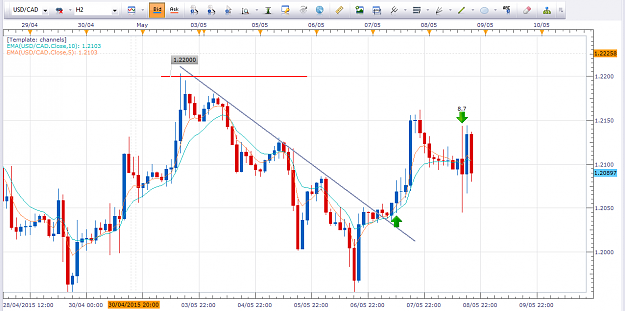
USD/CAD Back to that... 1.2000 level well behind that downtrend now. so since I looked at it this pair formed a double top. probably a sign of downtrend continuation (if it breaks the low of it) and it looks like it is going to do so. today we have ...
Trade to the point
- Motish replied May 13, 2015
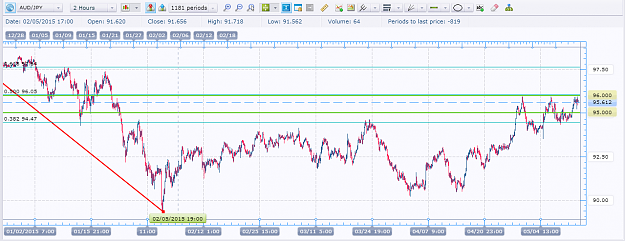
Line has broken yesterday and I missed it... grrr.... should've placed a buy order on the 95.00. I will wait for breaking of 96.00 with a retest. if that will happen I can buy again. If I will see a pin bar around 96.00 - sell. image image
Trade to the point
- Motish replied May 11, 2015
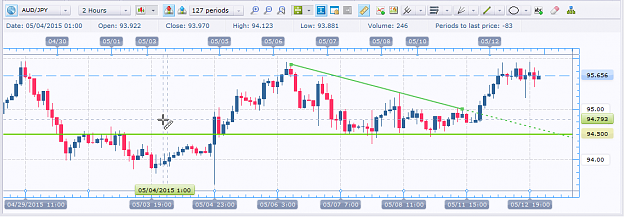
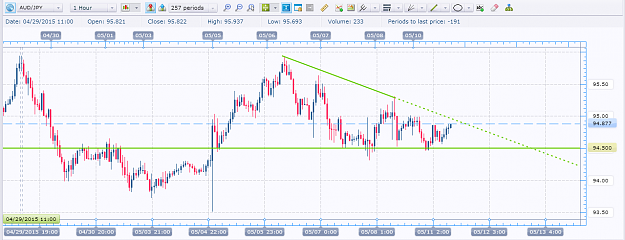
AUD/JPY 94.50 - the level was tested today from above but no break. also I dont see any uptrend signal. zoomed in to 1h chart to search for clues... didn't find any. image
Trade to the point
- Motish replied May 11, 2015
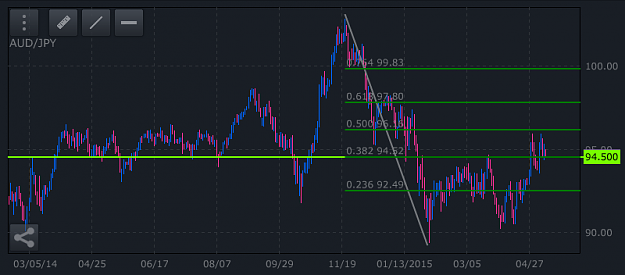
94.50 level on AUD/JPY Look at the chart. This level goes way back. It is also a fib level 0.382 of the last large downtrend. After ignoring it in the last couple of weeks. Price is testing it from above. If it fails... I search for a buy signal. ...
Trade to the point
- Motish replied May 8, 2015
High volatility today and I am stopped out. After 5 years in trading and I still forgot the non-farm Friday... so unprofessional. Next time I should close positions before big news or at least part of it. image Specifically here, I should have set ...
Trade to the point
- Motish replied May 6, 2015
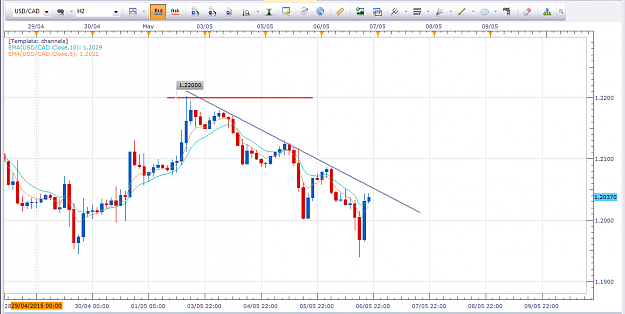
Lets zoom in, here is 2 hours chart. If price breaks the downtrend upwards it is a buy signal. I would love to hear suggestion on money management for this trade from some experienced traders as this is my major drawback now. I can go for the 1.2200 ...
Trade to the point
- Trade to the pointStarted May 6, 2015|Trading Journals|19 replies
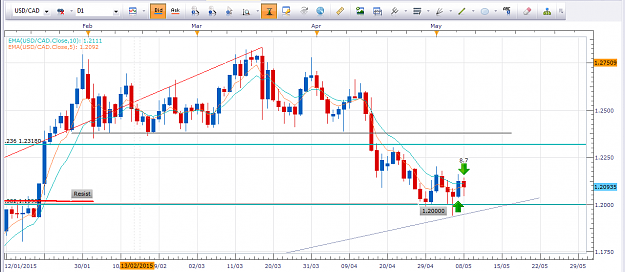
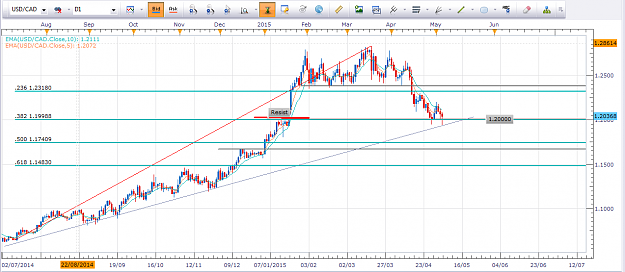
USD/CAD on a daily chart. price retraced to 1.2000 support level that was previously a resistance ...
- Motish replied Apr 26, 2015
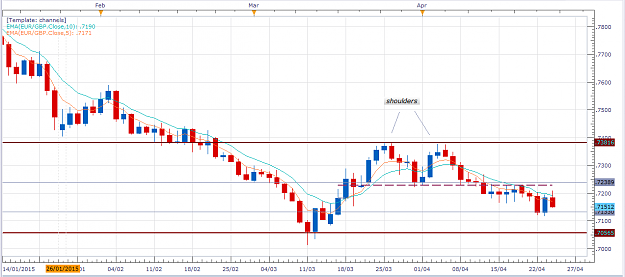
Hi Olu. have you had any new thoughts about eur/gbp? to me it looked like it is going down but than a bullish bar and now I don't know. so the pair broke 7162 level. do you think there was anything to do with it? image
Trading For Those With a 9-5 Job
- Motish replied Apr 20, 2015
Hi All. I did not read the whole thread yet, as I saw recommended. it will take me a while
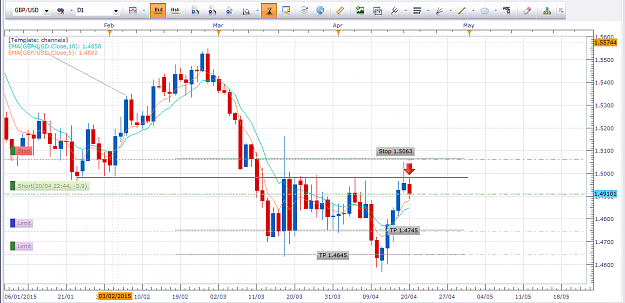
james16 Chart Thread Can I post a thought here and get your opinion on it? would you short this pin bar? my stop is exactly on 0.5 fib level that runs from the top you ...
- Motish replied Apr 19, 2015
Hi Olu Happy to post for the first time in this forum here.
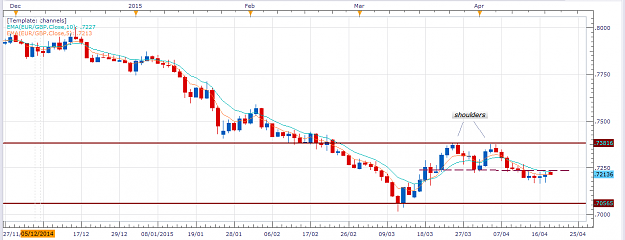
Trading For Those With a 9-5 Job just wanted to give you another thought about eur/gsp: Your 4h chart from the 6 of April is nice. to me it looks like market is retesting the level you drown as a resistance now. what ...
- Posts by Member Search: 'Motish'