- Search Forex Factory
- 111 Results (6 Threads , 105 Replies )
-
 MaxenshteinD replied Jan 26, 2019
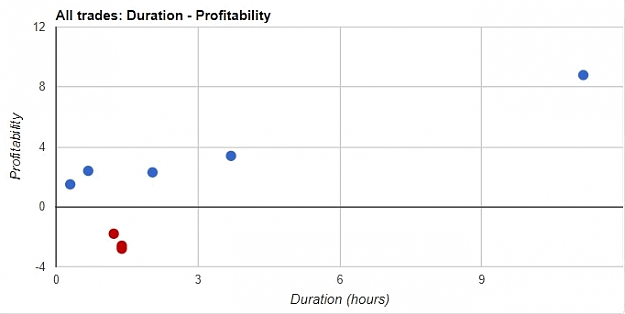
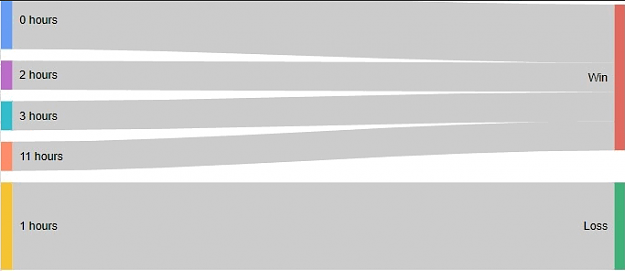
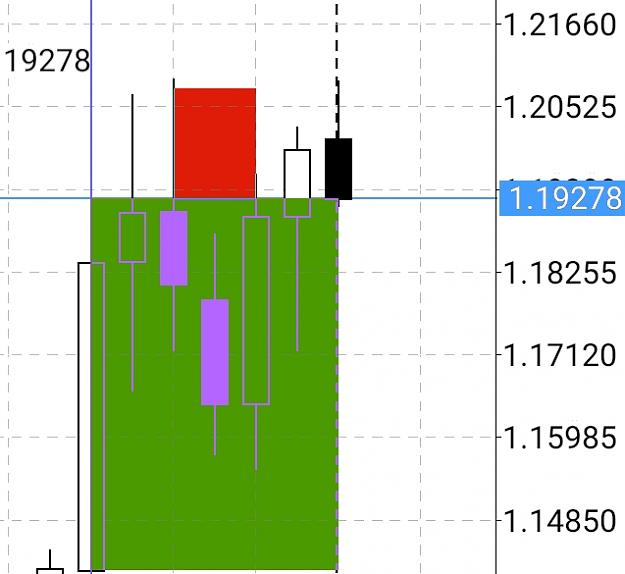
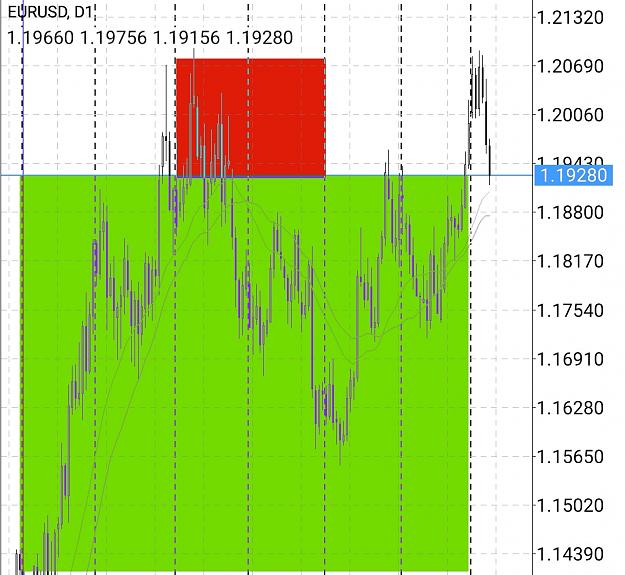
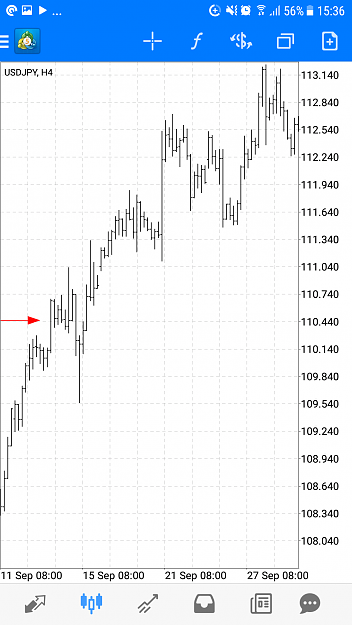
This is what a day of DIBS style trading can look like The crucial point is the hot hand
The DIBS Method... No Free Lunch continues
- MaxenshteinD replied Jan 22, 2019
I once created an unweighted index for each of the 8 currencies. Everything was fine until I decided to index the indexes...... Now I thought that I messed up with the formulas, however after double checking what came upon my eyes was the literal ...
Market mechanics
- MaxenshteinD replied Dec 18, 2018
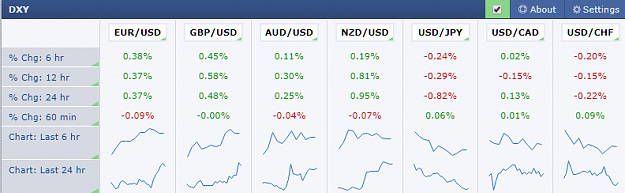
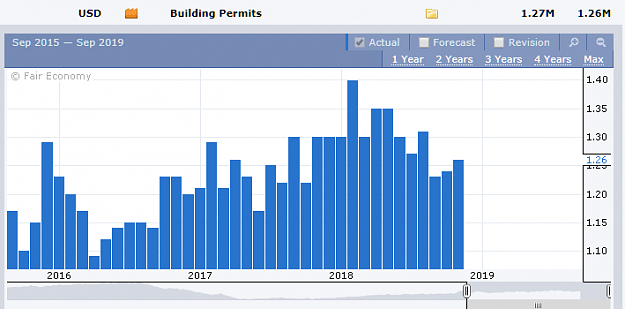
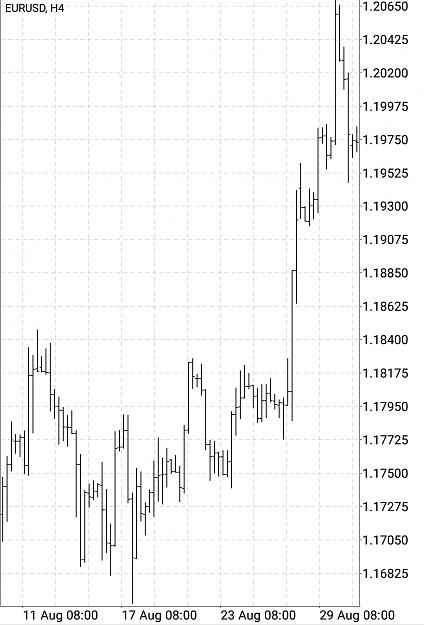
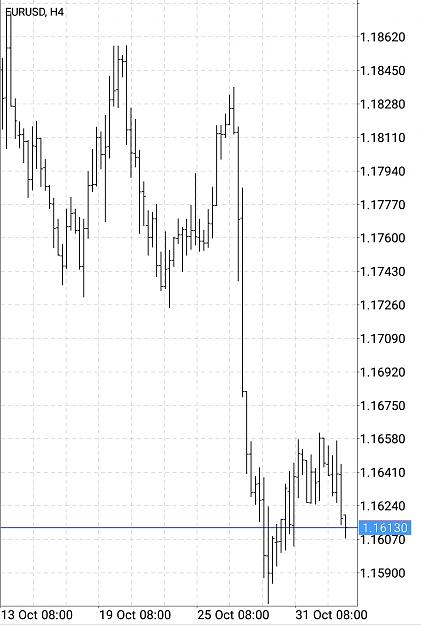
I don`t usually post here, but since im bored... Waiting to jump in to the weakness of USD after the minor correction ends. USD shows weakness all over the majors. The upcoming soon report of Building Permits in USA might weaken the dollar even ...
EURUSD only
- MaxenshteinD replied Dec 17, 2018
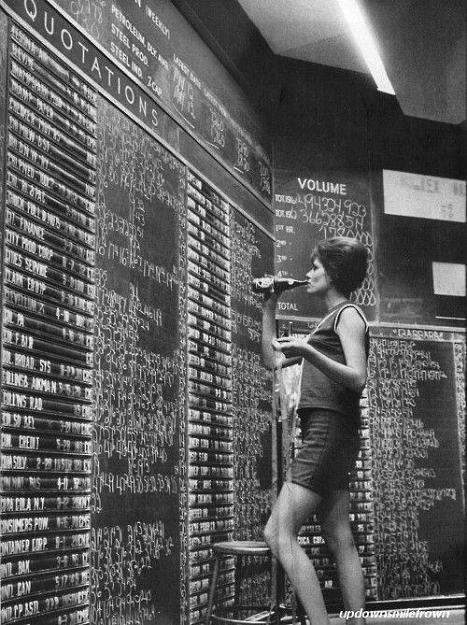
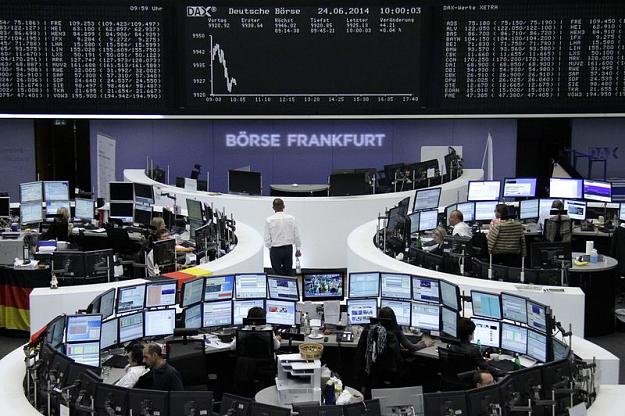
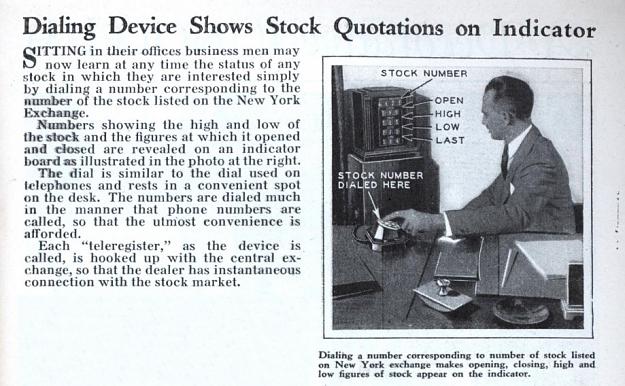
Question is why are OHLC prices still used even today in : modern terminals such as bloomberg, stock exchange floor boards, financial news quotes ?
How traders made money with previous high low, open and close?
- MaxenshteinD replied Jun 21, 2018
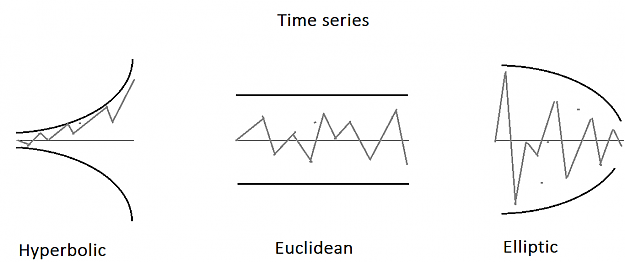
Personally I have rules : 1. Identify the trend 2. Identify the median of that trend 3. Identify the range around that median where the market is considered to be in a range I`m sure you heard and seen trending periods, and ranging periods. The ...
How to buy/sell the dips in a trend?
- MaxenshteinD replied Jun 21, 2018
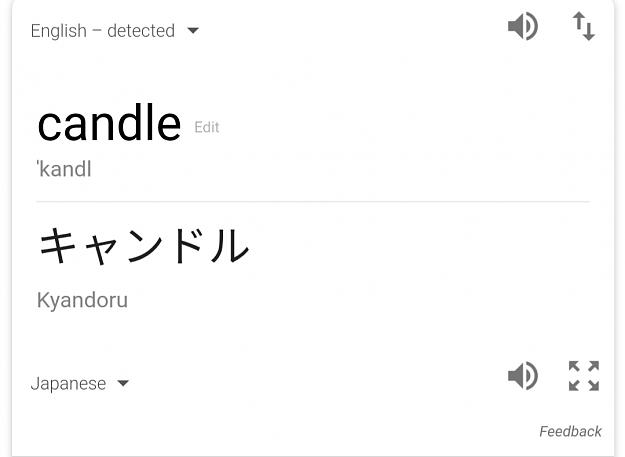
I think the whole overbought/oversold thing not being logical is a result of : a) traders collecting quotes and passing them to each other, without even trying to understand them b) translation c) the trading educators leveraging on the problems ...
Theory of "8-Currencies - Overbought/oversold"
- MaxenshteinD replied Jan 23, 2018
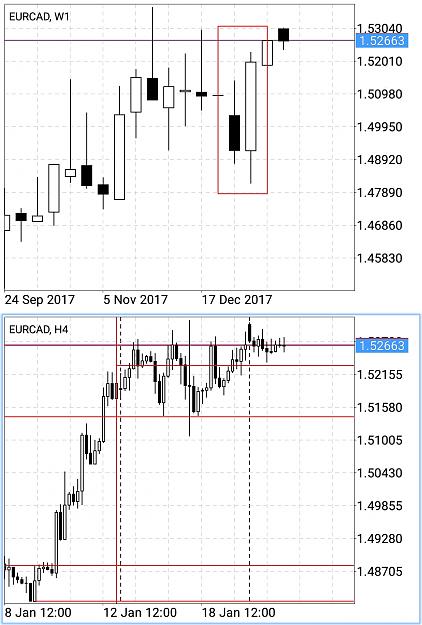
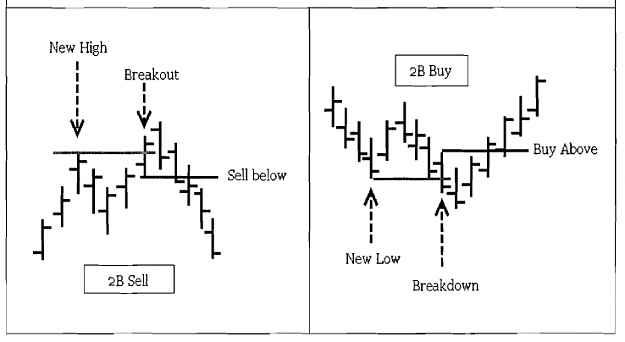
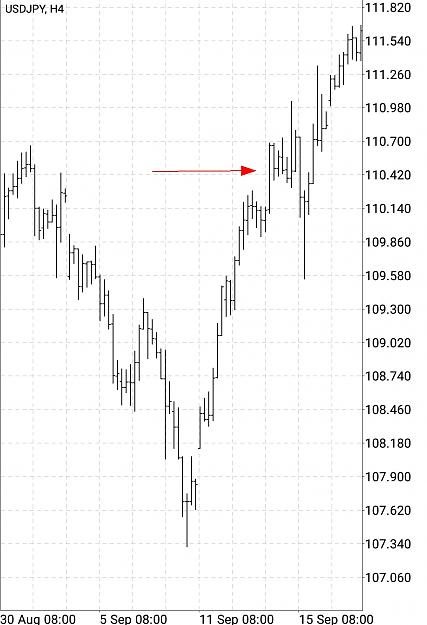
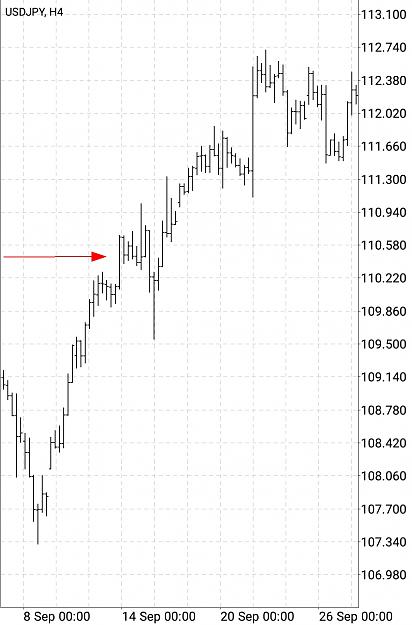
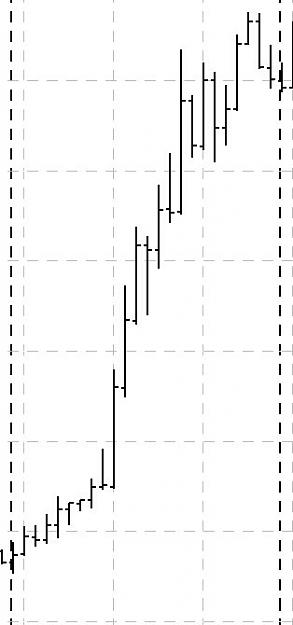
By the way, notice how a consolidation formed between the HIGHs of the two candles. Might be an opportunity on a lower tf. I wonder how often this occurs.
I challenge you to fail with this
- MaxenshteinD replied Jan 23, 2018
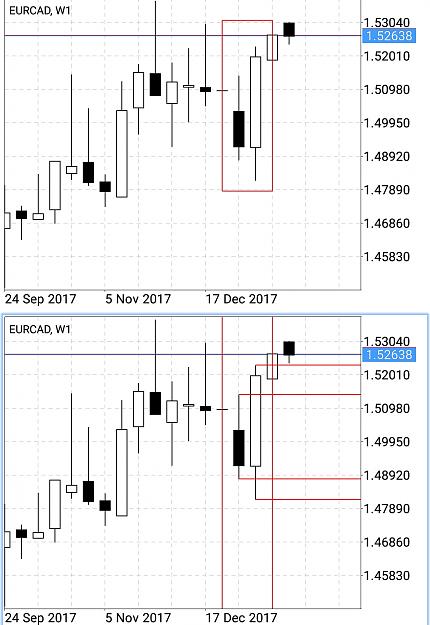
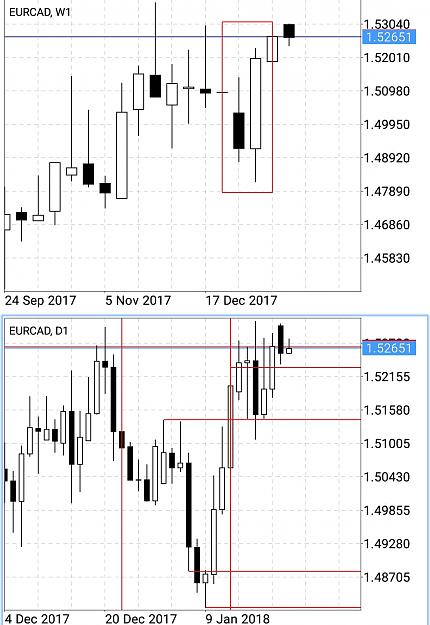
I dont want to derail the thread. But this seems similar. I guess you could do that if you find patterns on D1, but trade from h4/h1
I challenge you to fail with this
- MaxenshteinD replied Jan 16, 2018
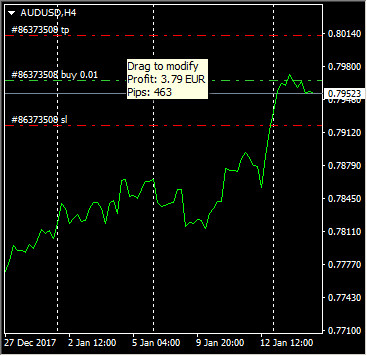
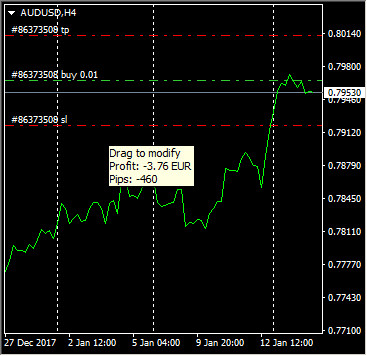
Does mt4 factor in commission+spread when showing profit/loss on trade levels in currency ? Perhaps someone knows the formula on how they are calculated
Creating a trade calculator in Excel
- MaxenshteinD replied Jan 10, 2018
I couldn't get your "fuse" term for one of the wicks out of my mind. And then it just hit me with an idea...
The Equilibrium, a key to success!
- MaxenshteinD replied Jan 9, 2018
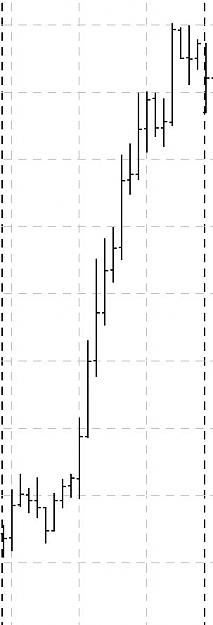
This is how the entire price history in your chart would look like if it was just 1 candle.
The Equilibrium, a key to success!
- MaxenshteinD replied Dec 26, 2017
Is this how a divergent system should look like ?
Trade Explorers Pattern Poll
- MaxenshteinD replied Nov 1, 2017
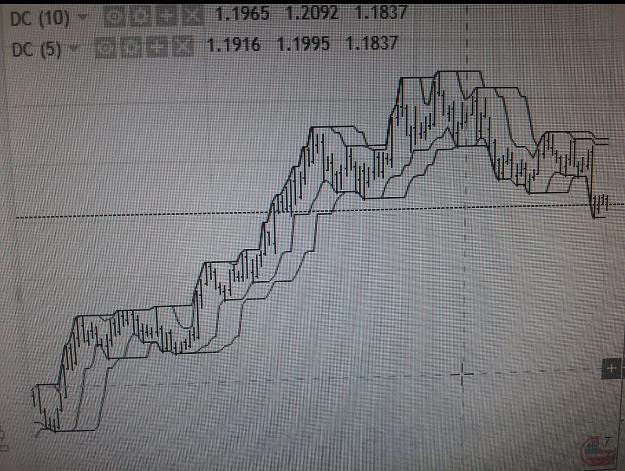
Didn't Turtles use 5 and 10 periods for Donchian Channels ? This allowed them to see a shorter and longer momentum. On breakouts the shorted and longer donchians merged together. On consolidations they diverged. image
How to properly use indicators
- MaxenshteinD replied Nov 1, 2017
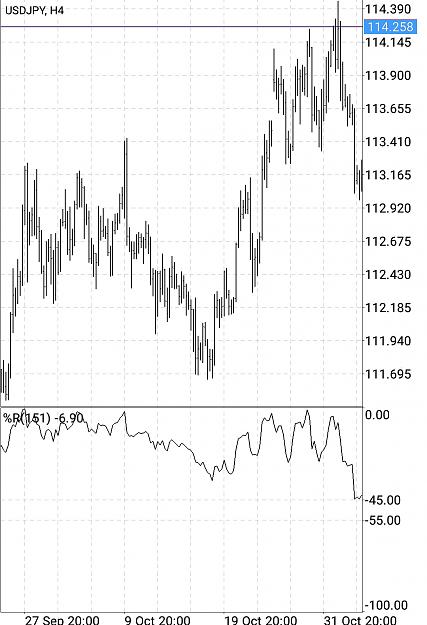
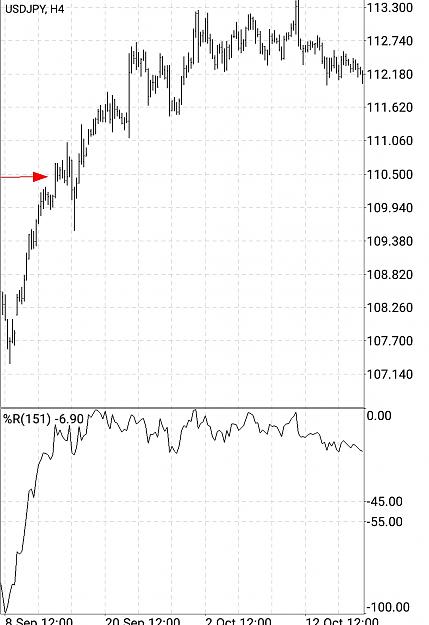
The latest R% reading shows where we are in relation to our boundaries.
How to properly use indicators
- MaxenshteinD replied Nov 1, 2017
Here you are updating your historical highs. You have no history further than 80 bars ago.
How to properly use indicators
- MaxenshteinD replied Nov 1, 2017
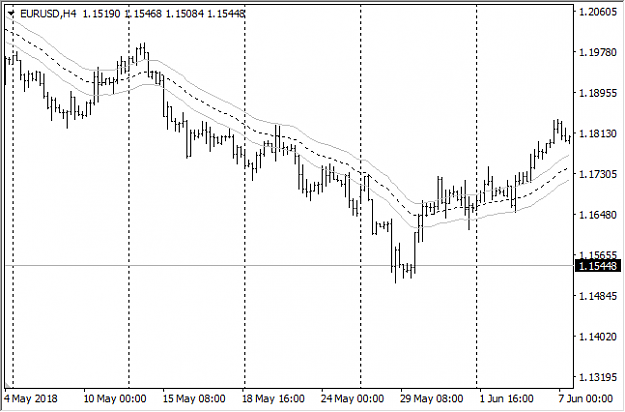
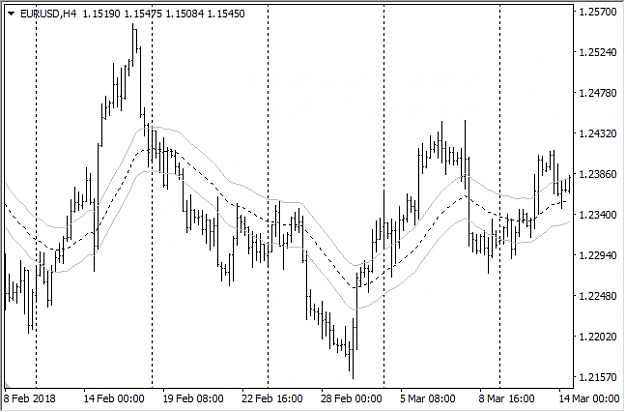
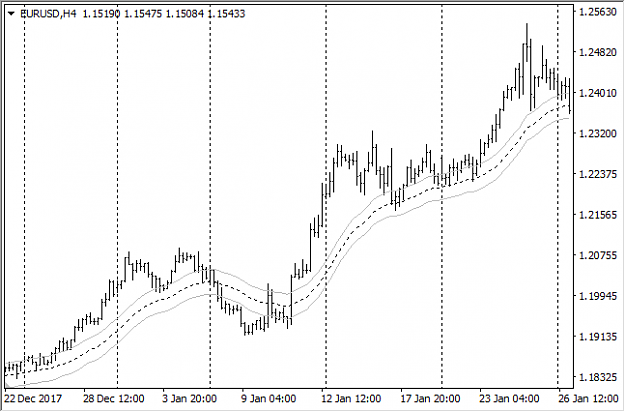
Each chart here is an 80 bar rolling timeframe. You can visually see the opening price of it, the high&low, and where the current price fits in between them. Visually draw 80% 50% 20% levels and you also get your overbought/oversold
How to properly use indicators
- MaxenshteinD replied Oct 5, 2017
Simple maths. the less of the total range is below open, the more range should be above open. Now research the following, the relation between oc and ol in bullish candles.
Higher Edge within a Single Candlestick
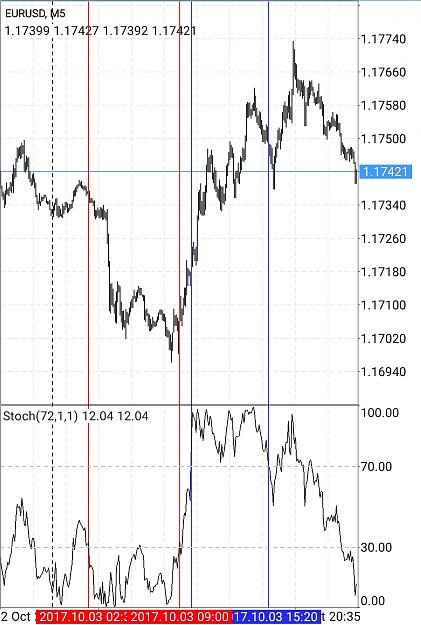
- MaxenshteinD replied Oct 3, 2017
Stochastic Pick a long enough period for the overbought/oversold to last longer. Say 6 hours. Pick a low enough timeframe. Say 5m. 6*60=360 minutes Adjust for m5 360/5=72 Was I influenced by crucialpoints multiple tfs from one chart for calculations ...
Higher Edge within a Single Candlestick
- MaxenshteinD replied Oct 2, 2017
Why is information about the origins of the candlestick/western bar so unknown ? We don't know the creators, the ones who made it known initially... Furthermore how was the high/low recorded through out the candle sticks period ? What period ? How ...
Higher Edge within a Single Candlestick
