- Search Forex Factory
- 62 Results
-
 Macedonia replied Feb 5, 2019
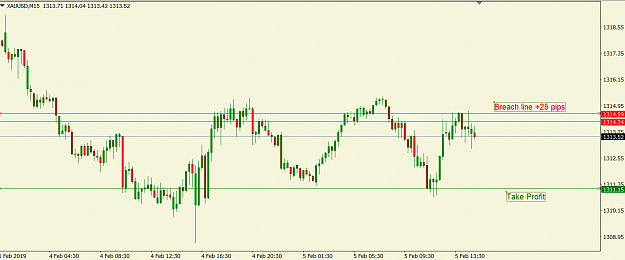
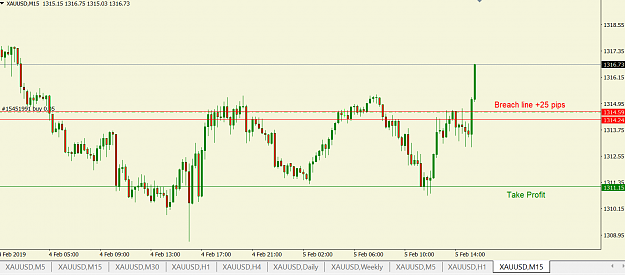
Hello FXCyborg. Here is a live chart XAU/USD 15m. Am i onto something? Edit.... (See picture 2) would have stopped me out with minimal loss. Either I've done something wrong or its a case of you lose some, it happens. Quite possibly Gold is a beast ...
High Level Accuracy Method With Little To NO Draw-down
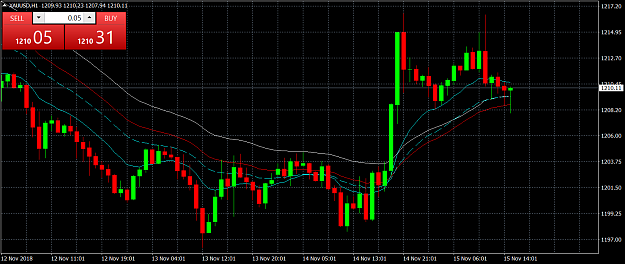
- Macedonia replied Nov 15, 2018
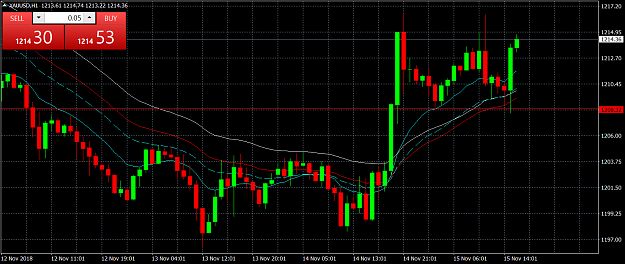
Hello huatzhi, This XAUUSD is the Devil. The last hourly candle (if i'm reading it correctly) moved 600 pips. It can eat you up on long term charts which is why i won't trade this particular pair above 1 hour chart. Yes long term its bearish, but ...
Strat's PASR Long Term, Stress Free Trading
- Macedonia replied Nov 15, 2018
I know the 1 hourly chart is not everyone's cup of tea, but i find it works ok for me. I should have noticed the BEOB preceding the hammer i entered and it wasn't a safe scenario. image By the way, the bulls keep fighting with those long bottom ...
Strat's PASR Long Term, Stress Free Trading
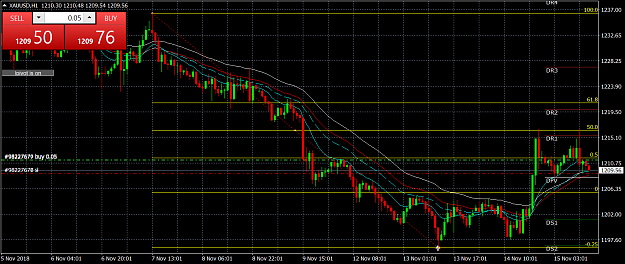
- Macedonia replied Nov 15, 2018
just a quick self analysis using what iv'e read so far using PASR (please correct me if you may) This is just a practice account. XAUUSD a perfect retrace twice to 50% fib which shows its a tough resistance. But the 3rd last candle has ended up a ...
Strat's PASR Long Term, Stress Free Trading

- Macedonia replied Jul 16, 2010
I will take it a step at a time. First set of rules. A)Candle close above/below the A1K line (on this chart it closed below and the red arrow indicates which candle) B) Entry is at retrace to the A1K line for short (to minimize stop loss). If the ...
Requesting programmer assistance with custom indicator

- Macedonia replied Jul 16, 2010
Disregard my last post. I redownloaded the slope indicator and changed the name before it whent in the indicator folder and now it works. I also get the arrows now
Requesting programmer assistance with custom indicator The only issue is, look at the red arrow......it has not realy croosed ...

- Macedonia replied Jul 15, 2010
OK here is a 1minute chart. you will see that it crossed but i did not get an arrow like you did. hmmmmmm i wander if i have to tick "Allow DLL Imports"
Requesting programmer assistance with custom indicator

- Macedonia replied Jul 15, 2010
Thanks sangmane.... and pleased to meat you.
Requesting programmer assistance with custom indicator they are minor issues. A) the first chart G/J i received the email on the candle close (indicated by the arrow on the chart) But the message i get on my email is "it closed above" where infact ...


- Macedonia replied Jul 15, 2010
could a programmer please be generous enough to add something to this custom indicator? I am willing to pay. The indicator is called "A1K forex index ver 2" this is what it looks like.(red and blue ma looking lines) What i need added is a email ...
Requesting programmer assistance with custom indicator

- Macedonia replied Aug 7, 2009
Na... just bounce off yelow line. does not like the colour yelow
Auslanco - GBP/JPY and GBP/USD (newstrade) but seriously, a close this hour below 159.50 we are bearish for the rest of euro market period. i am off no more trading nfp night day evening where ever you come from. safe ...
- Macedonia replied Aug 7, 2009
did not imply you mocked him i talked about back in 07 he was respected but not taken seriously about a big crash. anyway, NIKKEI has turned bearish my opinion looking back at the hourly chart. But we are now at the weekly pivot. this will be a ...
Auslanco - GBP/JPY and GBP/USD (newstrade)
- Macedonia replied Jul 30, 2009
For those that don't have enough indicaters here is another. A good one. its called FF CAL. it displays the ff news event coming up that only efects the pair that you aply this indi to. its a great heads up so you know what the next news event is ...
Auslanco - GBP/JPY and GBP/USD (newstrade)
- Macedonia replied Jul 28, 2009
Just trying to add to my knowledge. This looks like a ABC retrace of the previous fall. its nothing but stop hunt before another big fall. My theory is many would have put stops at point A or even added shorts. then she went down a little to B but ...
Auslanco - GBP/JPY and GBP/USD (newstrade)
- Macedonia replied Jul 28, 2009
But talk about price action, A) three days ago the candle closed a nice bulish candle. B) two days ago, candle was a inside bar C) yesturday, candle is a bullish engulfing. And closed above trend line I read and hear alot about PA. now this should ...
Auslanco - GBP/JPY and GBP/USD (newstrade)
- Macedonia replied Jul 28, 2009
Here you go, 1 hour low volume (not above the red line) if volume was high it would have smashed your short entry at the resistance line.
Auslanco - GBP/JPY and GBP/USD (newstrade) lol you asked for it
- Macedonia replied Jul 23, 2009
i posted a daily chart yesturday sugesting it would be a bulish day and price could go to the uper trend line. it surpased it by a bit but the main thing is it closed back down below it. It shows me its a bearish sighn. I will not short yet though ...
Auslanco - GBP/JPY and GBP/USD (newstrade)
- Macedonia replied Jul 22, 2009
my daily sentiments are bullish (does not mean i will not short on lower time frames). why? A) yesturdays candle is bullish to me. long botom wick shows bulls had the power B) good earnings reports are coming out left right and center. C) if this ...
Auslanco - GBP/JPY and GBP/USD (newstrade)
- Macedonia replied Jul 22, 2009
I can't believe i am on the same side as lion
Cable Update (GBPUSD) but i agree. 1st we need a half hour, evan better, 1h close below this yelow solid line. keeps diping below but closes above. if we close above the white doted line we would go up a little posibly to ...
- Macedonia replied Jul 21, 2009
The blue line on the 1hour chart below which is at 154.70, is where the 4h gann is. we need a close below it to travel further south. its made a few attempts but keeps on jumping up above it just before close.
Auslanco - GBP/JPY and GBP/USD (newstrade)