- Search Forex Factory
- 3 Results
- Kramer replied Nov 6, 2007
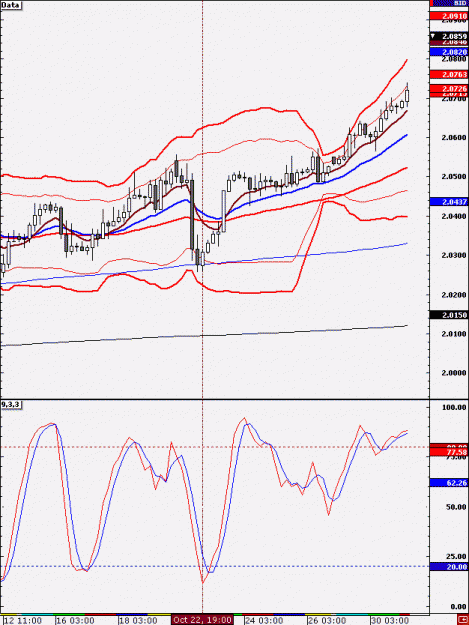
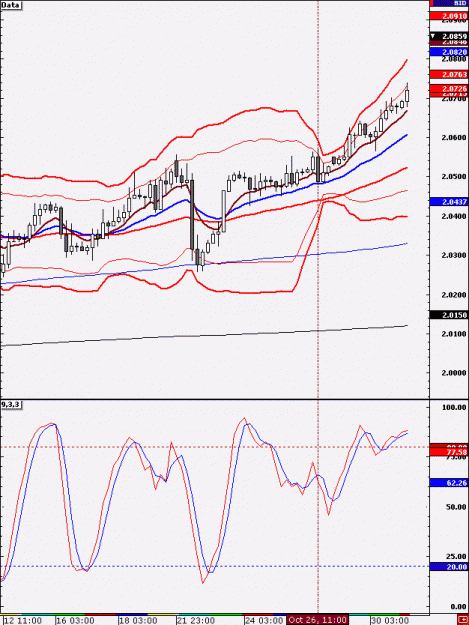
Trade Screenshot No.3: GBP/USD — This is an example of a trade set up I’m always on the look out for. Price breaks through BB3 on 1H, BB2 on 4H, and finds support on the 200SMA on the 4H (which is also the 800SMA on the 1H chart). It hovers ...
Bollinger Band Confluence Trading
Attached Image(s) (click to enlarge)
- Kramer replied Nov 6, 2007
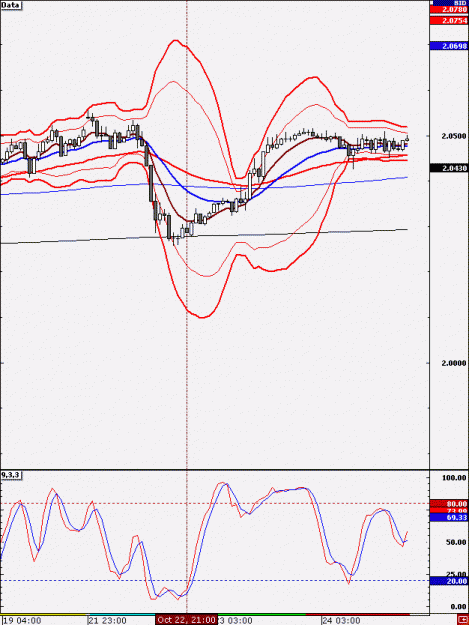
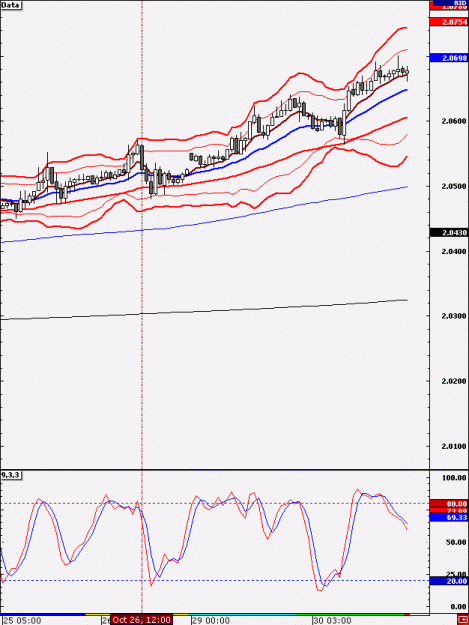
Trade Screenshot No.2: EUR/USD — Here was another textbook trade. Price had moved up very strongly throughout the day, and had broken through BB3 on both 1H and 4H. As a general rule, when price touches the 3 standard deviation BB on the 4 ...
Bollinger Band Confluence Trading
Attached Image(s) (click to enlarge)
- Kramer replied Nov 6, 2007
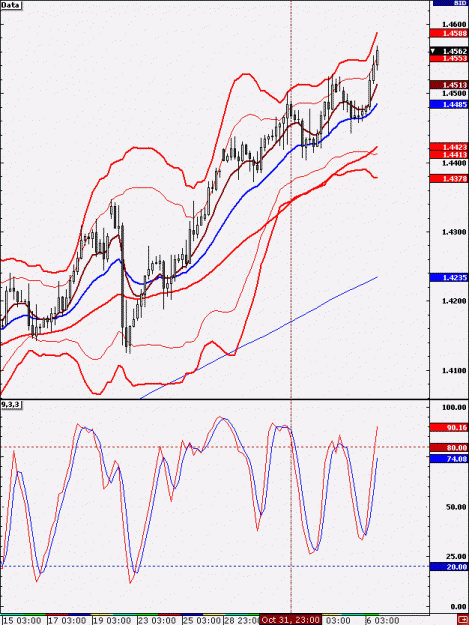
Trade Screenshot: GBP/USD — My chart settings are as follows: 8EMA (thick green line) 21EMA (thick blue line) 55EMA (thick red line) 200SMA (thin blue line) 800SMA (thin black line) Bollinger Bands (2 standard deviations, 20 periods) - thin ...
Bollinger Band Confluence Trading
Attached Image(s) (click to enlarge)
- Posts by Member Search: 'Kramer'