- Search Forex Factory
- 17 Results
- HeavenBlade replied Sep 18, 2012
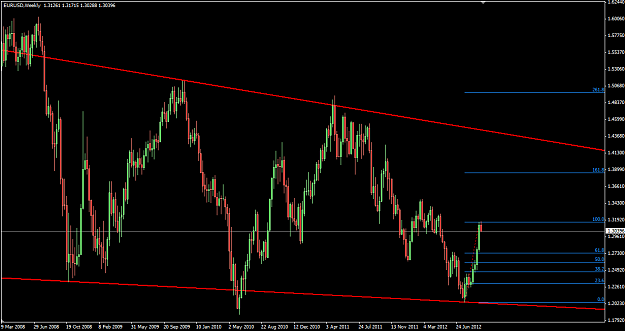
Haha this might be a stupid question to ask in light of the earlier post by Chicky, but I'd just like to ask the more experienced ones on this board their opinion of this chart (drawn on daily). I'm a novice so my questions may be silly. 1) Is my ...
EURUSD
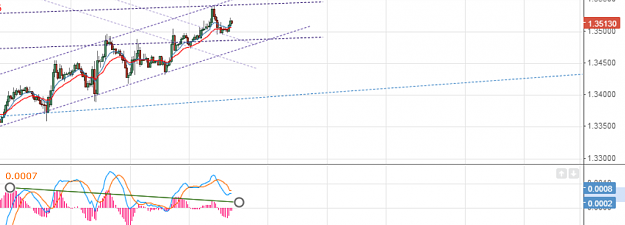
- HeavenBlade replied Aug 16, 2012
If all goes well, Euro will not break through back into this channel and we are back to downtrend. If it goes badly, Euro breaks through and renders the whole week's bear-action moot. I'm scared ><
EURUSD
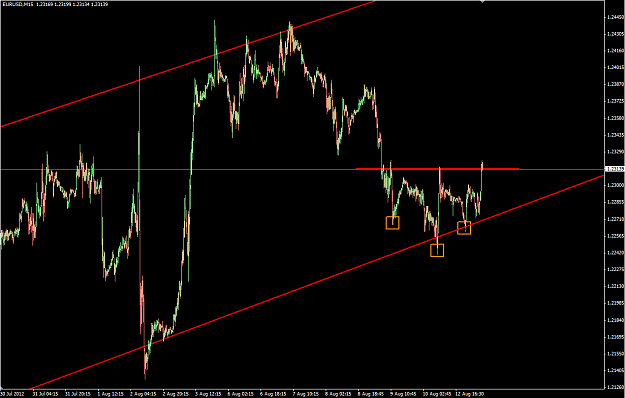
- HeavenBlade replied Aug 13, 2012
Hi, I'm not sure about interpreting this chart. Is it more of a triple top or an inverse H&S (or neither)? I ask because it looked to me at first that it could be an inverse H&S but I remember something about the last wave up having to break the ...
EURUSD
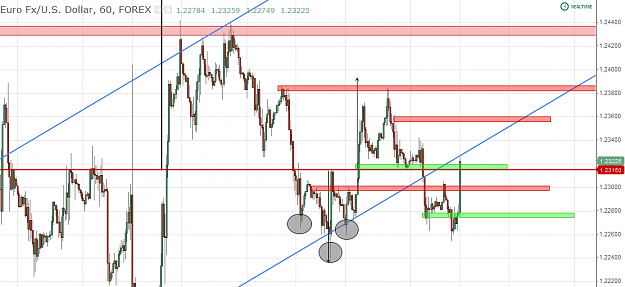
- HeavenBlade replied Aug 1, 2012
This is how it looks like to me. If it breaks 1.232, then 1.233, then 1.234, we may be looking at a EUR lift-off. If it fails to break it could be some safe shorting down at least 80 pips.
EURUSD
- HeavenBlade replied Jul 25, 2012
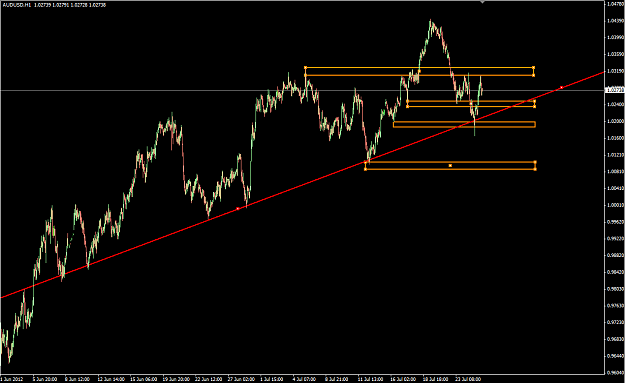
That's just my take on it. There's an intersection at 1.024 of demand zone with lower trendline, but it might just fall right through. Other demand zones at 1.020 also possible. Supply zone at 1.0315-1.0320. Your call. Bouncing off the trendline ...
Aussie Trading Room and Cartoons Gallery
- HeavenBlade replied Jul 22, 2012
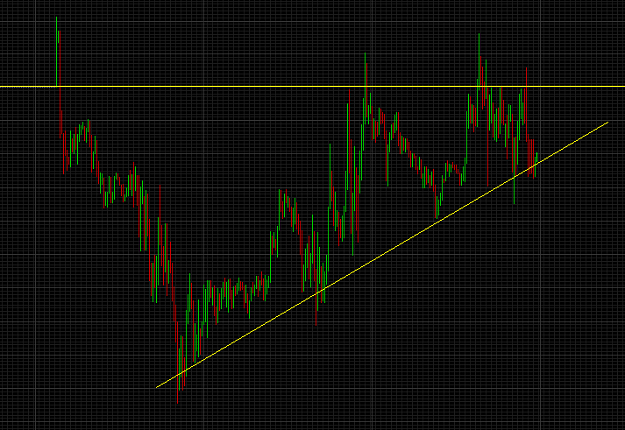
1.0315 is an area of resistance-turned-support. Question is how high it bounces and when will it break through.
Aussie Trading Room and Cartoons Gallery
- HeavenBlade replied Jul 19, 2012
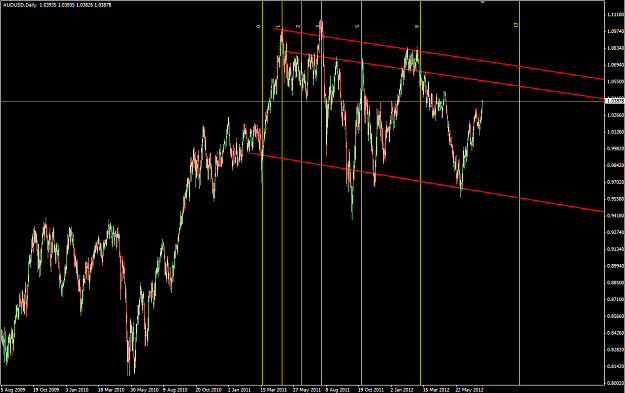
Pardon me if I'm reading it wrong here. The AUD daily does suggest a strong channel pattern. There could be a strong bullish trend that may finally bounce of at 1.055 signalling a downtrend for the rest of the year as the market adjusts to what ...
AUD/USD
- HeavenBlade replied Jul 8, 2012
Haha XD I used Oanda MT4. The 3 points on my attached chart correspond with these closing quotes: 1.01789 1.01793 1.01777 Perhaps it was a spread thing
AUD/USD
- HeavenBlade replied Jul 8, 2012
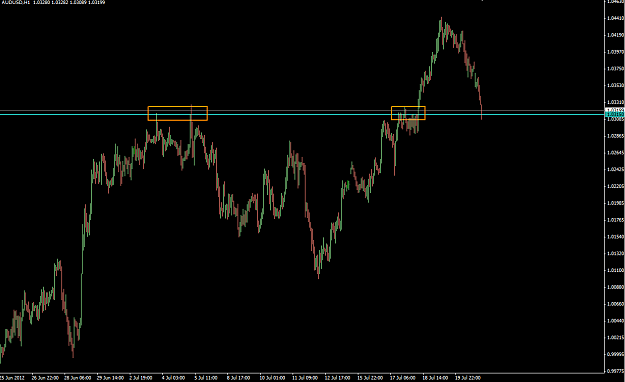
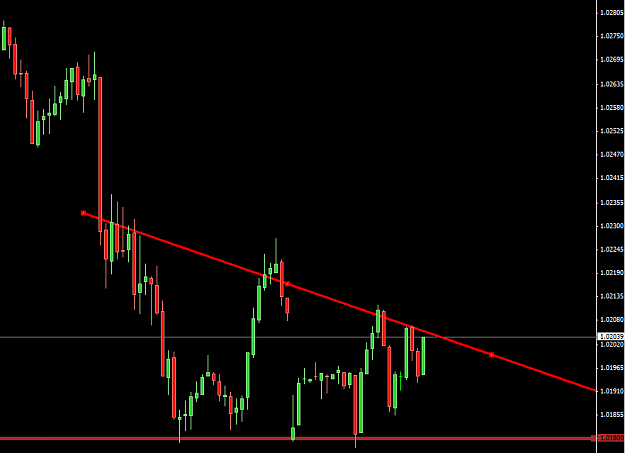
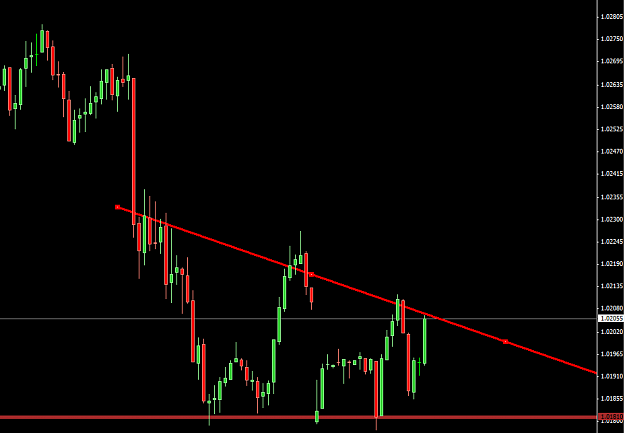
Tested 1.018 3 times. It looks like one of those descending triangles. image Compare with this:
AUD/USD
- HeavenBlade replied Jul 6, 2012
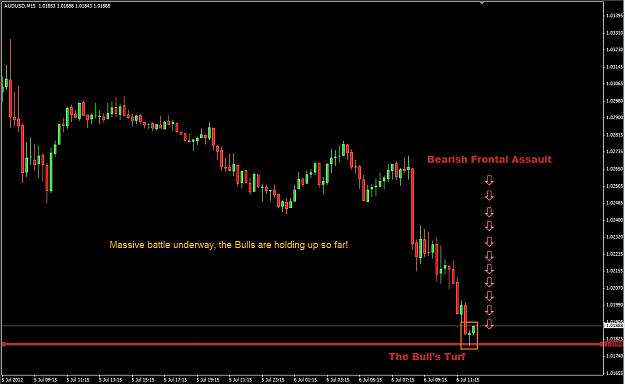
Let's go to the front line! In breaking news, the Bears have reached (but not breached) the Bull's fortress. It appears that the Bull's defense line is as of yet impenetrable. It may take many more attacks to take down. Will they manage to fight ...
AUD/USD
- HeavenBlade replied Jul 6, 2012
Well here's the battle plan. I believe the Bears will only retreat after touching the Bull's trench line. Let's hope they get a touch down.
AUD/USD
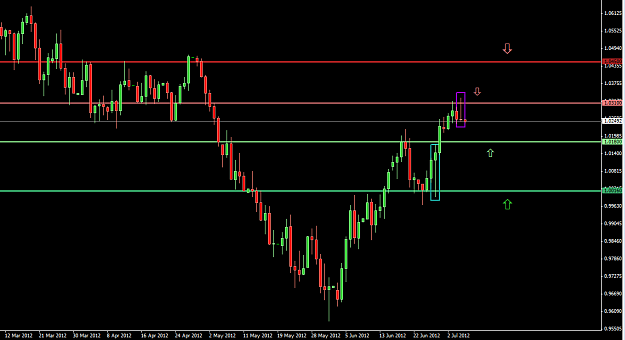
- HeavenBlade replied Jul 6, 2012
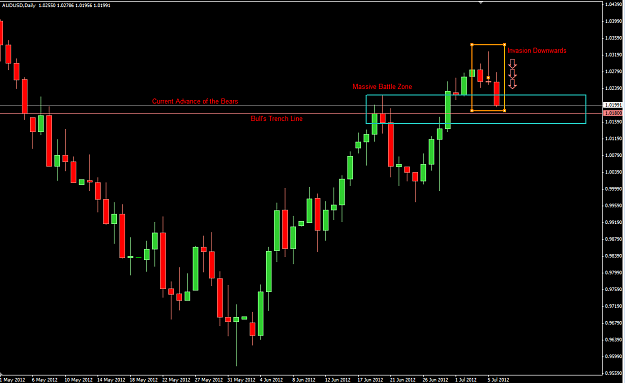
It's difficult to know exactly when it will move due to my current lack of knowledge, but from what I know, these are the major points of contention. The daily chart displays 2 candles, the big bullish candle and the smaller but very obvious bearish ...
AUD/USD
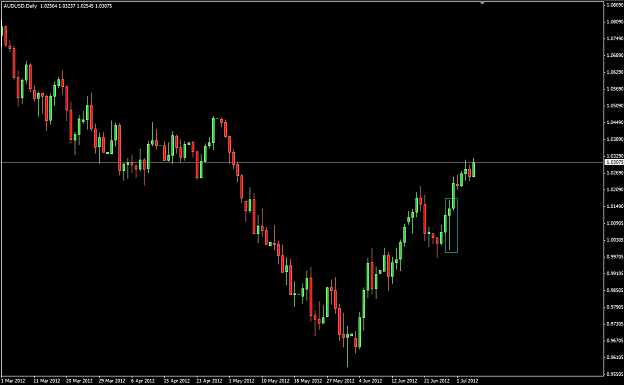
- HeavenBlade replied Jul 5, 2012
I certainly hope so. We'll have to wait until the hourly and daily candle closes before we can know for sure. I wonder when that mega-bullish candle on daily will run out of steam.
AUD/USD
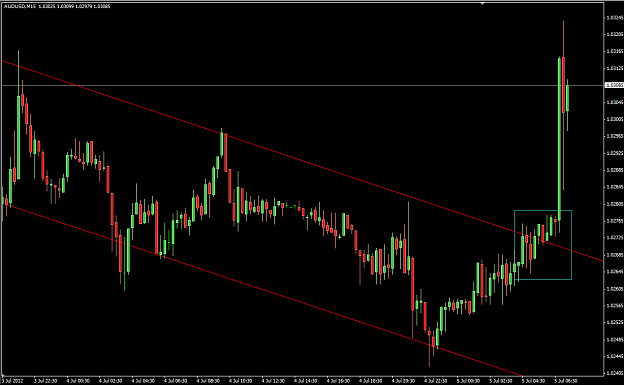
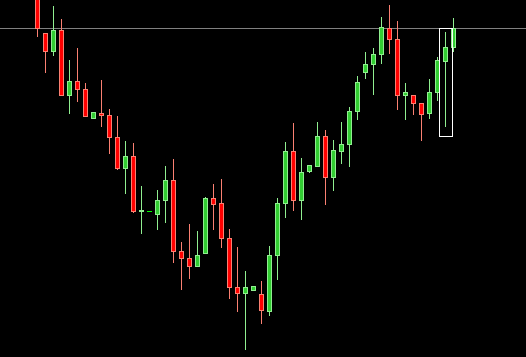
- HeavenBlade replied Jul 5, 2012
Well to learn from mistakes... there was no sharp and fast rejection candle when price first tested the upper channel. All that dallying action as seen in the square only shows that price may be consolidating upwards instead. Who knew it would shoot ...
AUD/USD
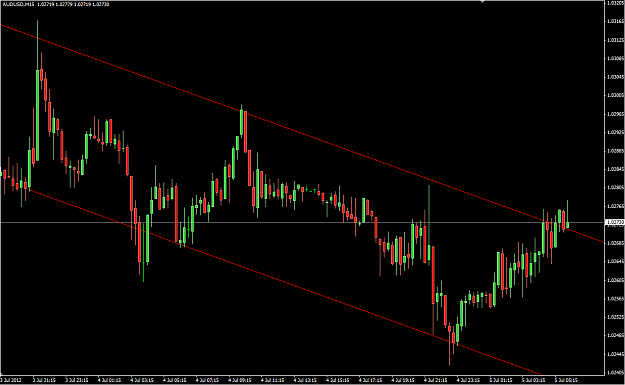
- HeavenBlade replied Jul 5, 2012
On the M15 chart we see a bearish channel. I am hoping that it breaks down!
AUD/USD
- HeavenBlade replied Jun 29, 2012
Essentially this is what I saw on the Daily Chart image And that shooting star there is not doing my AUD shorts any favours...
AUD/USD
- Posts by Member Search: 'HeavenBlade'