- Search Forex Factory
- 14 Results
- Goozman replied Jun 17, 2009
I know this chart is already in this thread, but I wanted to my best trade of the week, after having survived a retracement close to my Stop loss to the pip last night
james16 Chart Thread 300 sweet pips in one trade following simple rules

- Goozman replied Apr 27, 2009
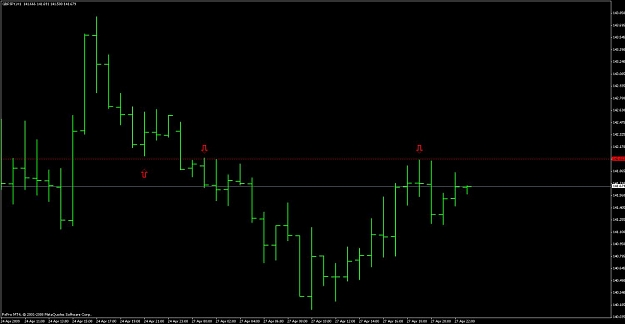
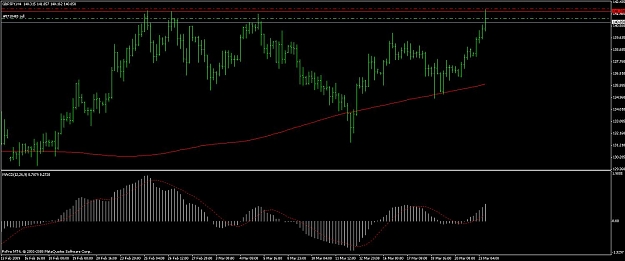
GBP/JPY Pin bar on the daily and on the 1h chart there is a nice ppz at 142.02. Two good reasons to go long if it breaks. image image
james16 Chart Thread

- Goozman replied Mar 23, 2009
Nice rally to the strong 141.70 resistance area. I think we may see a bounce here. If I am wrong, there's always the chance to recover the SL (if taken) on the break upwards.
james16 Chart Thread
- Goozman replied Dec 29, 2008
Yes that's right. Also: When price crosses the 200 moving average several times in a short period of time you will get a range, trade only when price breaks out of that range. Another basic and crucial piece of info for trend trading that many ...
How to Identify Major Movement in the Market
- Goozman replied Oct 31, 2008
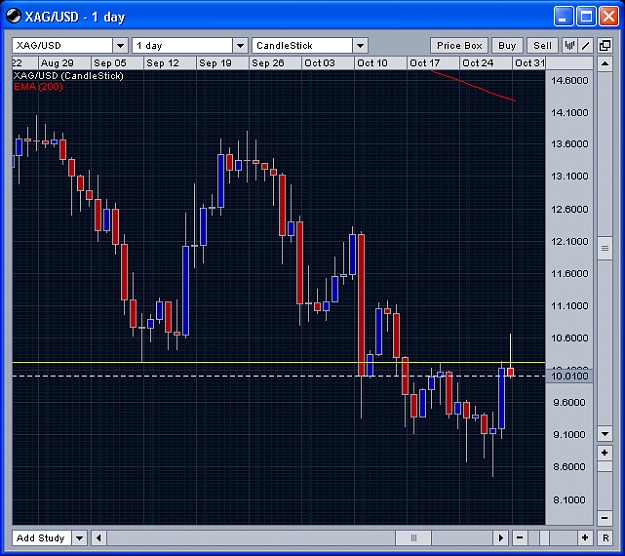
Did anyone profit from this nice Pin bar? So, silver broke a very clear trendline and made a higher high marked by that Pin bar and higher low now. Up scenario kicks in above 10.00 - 10.05 with a target of 11 or more (new high) and down scenario is ...
james16 Chart Thread
- Goozman replied Oct 30, 2008
There's a nice PB on the Silver 3h (for Oanda users) & 4h chart. The red line - 200 EMA, the other line - 200 SMA. The PB looks like a rejection in that area. With MACD also positive on these time frames, I'd say it's a nice setup worth at least 40 ...
james16 Chart Thread

- Goozman replied Oct 17, 2007
That was and probably still is a good trade. You just have to give it more space to breathe
james16 Chart Thread With MACD close to 0 and price very close to an important EMA (200), you can expect multiple tests before the market will decide which way it will go.
- Goozman replied Sep 25, 2007
That's a 4h Pin bar off some small fib confluence. Trade ideas: long while price > 2.0090, close and short below 2.0090.
james16 Chart Thread
- Goozman replied Sep 14, 2007
While looking at my USDCAD chart your ABC question popped up in my mind so I thought to draw this for you. After seeing this I closed all my USDCAD short positions... *back in the bush with my trusty sniper now.
james16 Chart Thread
- Goozman replied Sep 13, 2007
Two quick observations. On the 15m chart EUR/USD bounced off 200 sma. Given the small time frame, this moving average is not a strong one yet the price still could penetrate it. *writing on my mental-proof memo 1.3861 - first support On the 1h chart ...
james16 Chart Thread
- Goozman replied Sep 13, 2007
Saw this image somewhere else on this forum, and now I keep dreaming it. I must be sick. btw I dream charts all the time. Back to trading now. I have a feeling EUR/USD will visit 1.3850 - 1.3800 before taking out 1.40.
james16 Chart Thread
- Goozman replied Sep 11, 2007
Instead of waiting for USD/CAD to break outside the range, like I usually do; I traded the range instead. Very boring, but successful trading should be boring
james16 Chart Thread Looking at my 4h chart I see a ton of price action patterns, look how nicely the price ...
- Goozman replied Jan 9, 2007
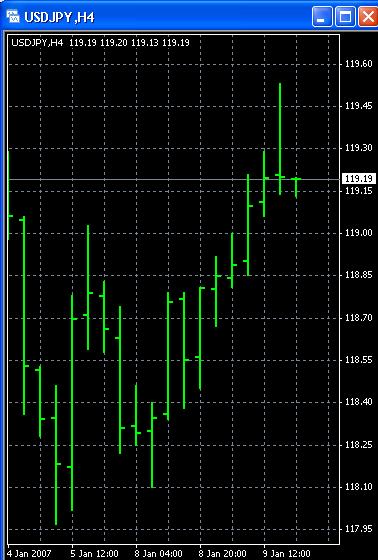
4h pin on USD/JPY already formed on my chart. Pin Bottom is around 119.13. image
james16 Chart Thread
- Posts by Member Search: 'Goozman'