- Search Forex Factory
- 11 Results (1 Thread , 10 Replies )
-
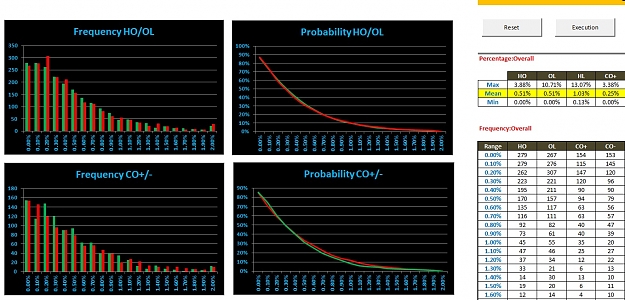
 Fx2ProTrader replied Jul 24, 2012
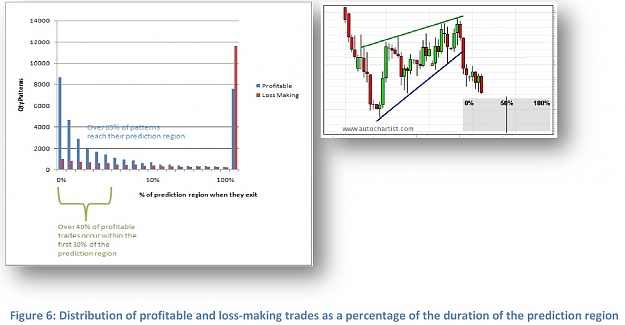
Rising Wedge Pattern -Analysis — The following image shows the quantity of trades that exit at some point in time as a percentage of the period of the prediction region. There are a number of interesting observations that accompany the above ...
Chart Pattern Trading Opportunity - Best?
- Fx2ProTrader replied Jun 13, 2012
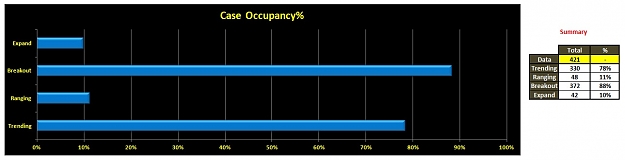
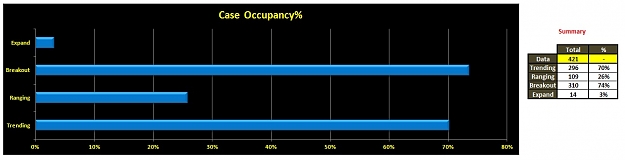
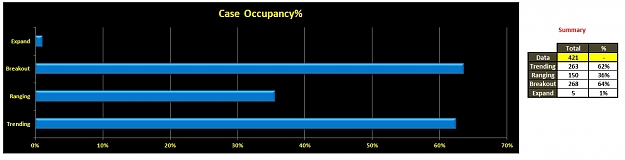
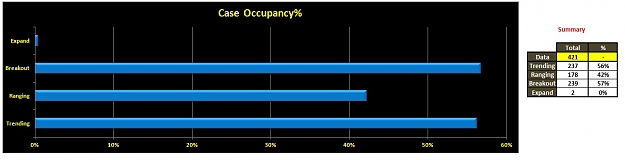
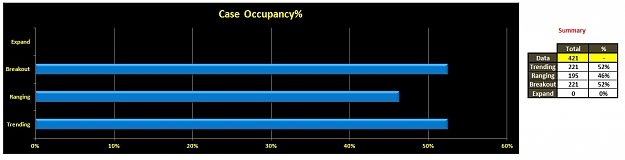
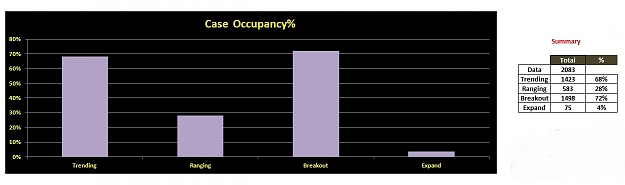
According to the statistical analysis, i have re-adjusted and upgraded my old analysis system. So there are more information now. Meanwhile, i will re-adjust my thread here in order to provide more information in details. Explanation of case ...
Simple logical trades
- Fx2ProTrader replied May 22, 2012
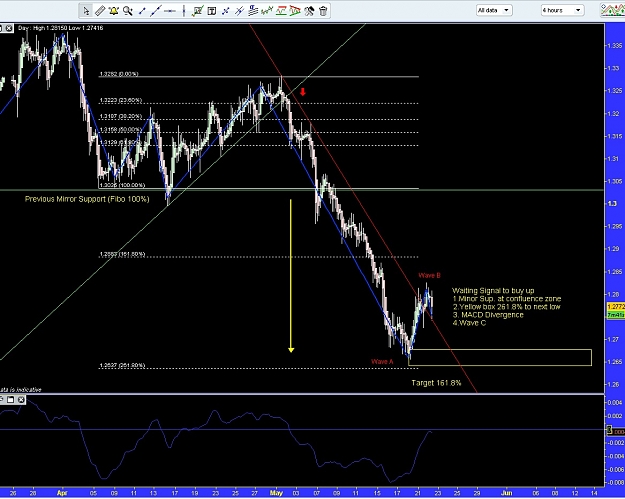
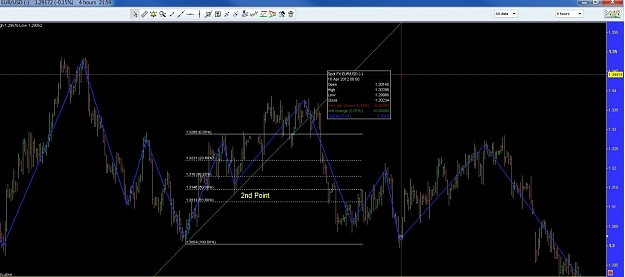
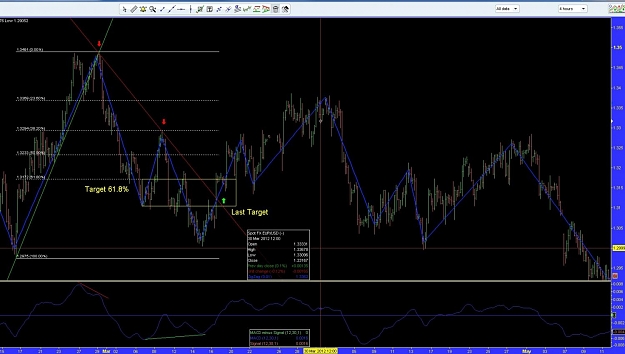
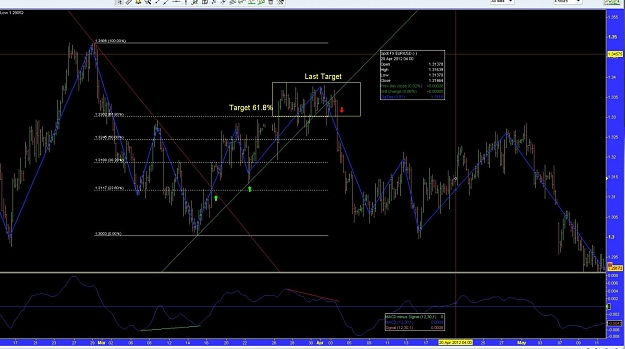
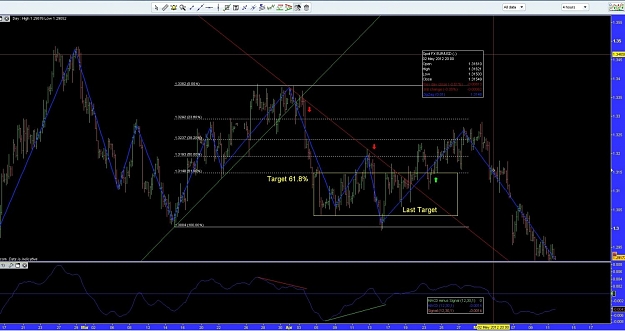
Continue......... — This is the continued post from May 2012 onward. Now the trend turns into trending behavior from previous ranging scenarios. Measurement of Fibonacci for trending behavior 1. Take previous minor support as Fibonacci level ...
Simple logical trades
- Fx2ProTrader replied May 16, 2012
I have been monitor you so far. GOOD JOB!
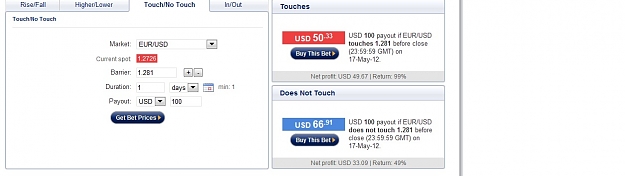
5% every 24 hours using set and forget - £200 into £1797! Could you please post your entry price and time as well? So we could know how your entry at the particular time. By the way, i took some time to familiar with BOM. But i found that BOM touch price ...
- Fx2ProTrader replied May 13, 2012
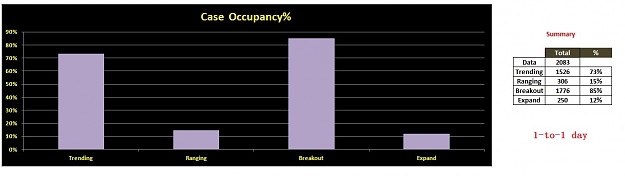
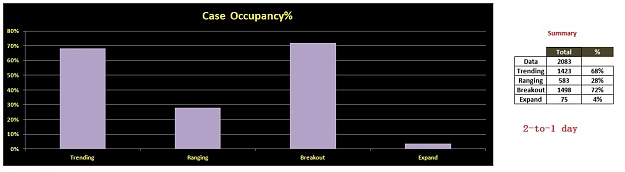
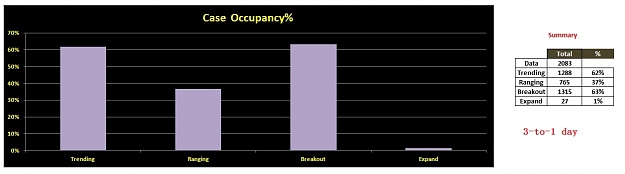
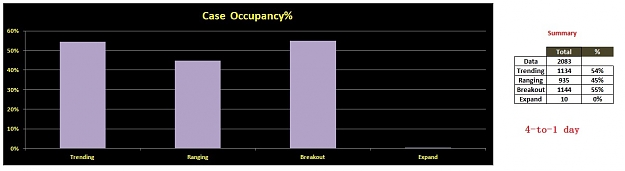
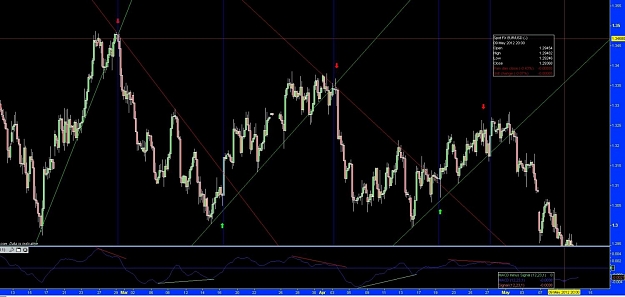
The reason for not to apply trailing stop loss..... — Price will tend to reverse after few days of rising/dropping trend in order to have a correction wave. According to my statistics analysis, trending behaviour for 1-to-1 day happens more ...
Simple logical trades
- Fx2ProTrader replied May 12, 2012
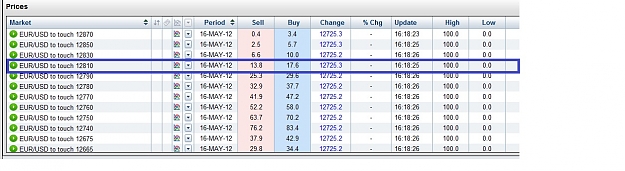
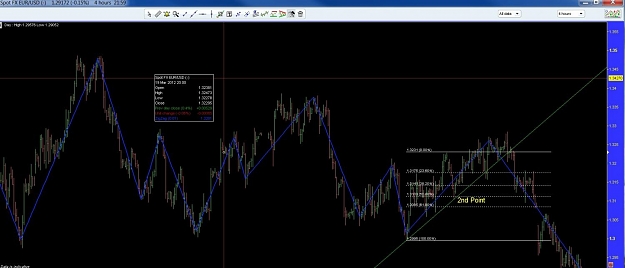
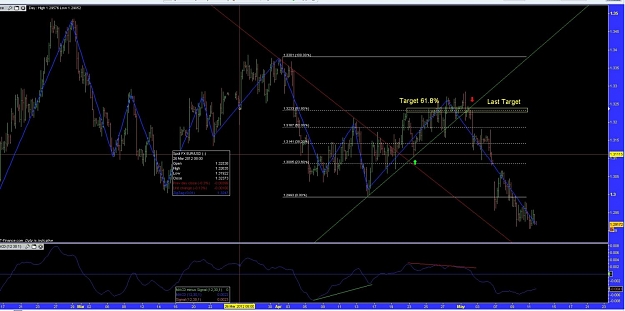
Continue from above..... — The below screenshot is the "Thereafter Opportunity Entry"
Simple logical trades

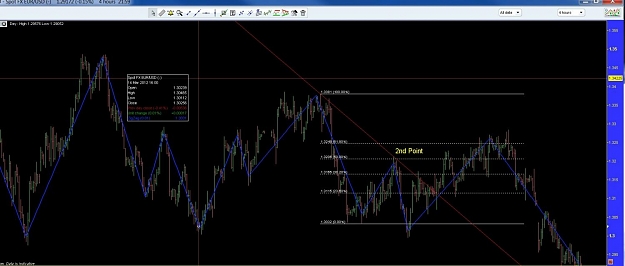
- Fx2ProTrader replied May 12, 2012
Explain in details..... — Statistics Analysis based on 7 years data. I spent long time to collect information and data to create this analysis system. To explain in details, i separate 3 sections screenshot for how the trade's ...
Simple logical trades
- Simple logical tradesStarted May 11, 2012|Commercial Content|25 replies

Hi all! This is the high probability simple logical trade.It combines/cover with Elliott Wave ...

- Fx2ProTrader replied May 8, 2012
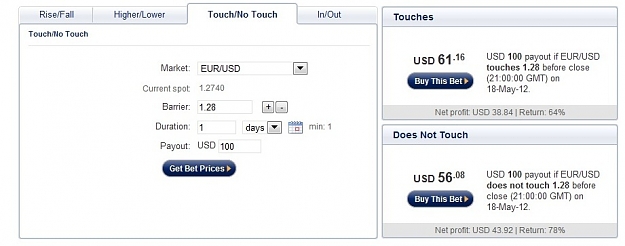
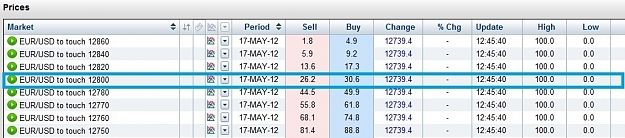
Example: According to my statistics analysis, i know that EURUSD at 1.32 is maybe 60% probability for price to be hit. So I buy weekly EURUSD binary ladder at 1.32(Above 1.32 is my earning conditions) at the opening of this contract. I will set an ...
5% every 24 hours using set and forget - £200 into £1797!
- Posts by Member Search: 'Fx2ProTrader'