- Search Forex Factory
- 24 Results
- Fractales replied Jan 17, 2024
image Is it possible to transform your lines MM into diagonals and see what that gives?
Analysis and Trading based on Envelopes, Waves, Cycles
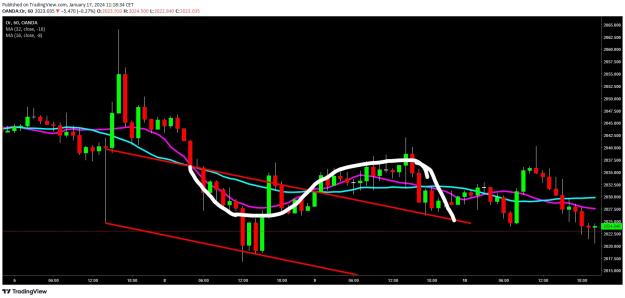
- Fractales replied Jan 17, 2024
image What do you think? by drawing diagonals along MA 32 with shift -16 and +16 entry into the 2nd wave (after the MAs have broken the diagonal) image another approach with a Tf vision 1 hour and 5 minutes (MA 192 TF 5 minutes = MA 16 TF 1 H)
Analysis and Trading based on Envelopes, Waves, Cycles
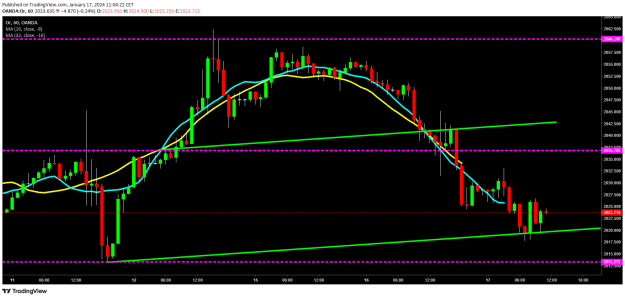
- Fractales replied Jan 17, 2024
image image work in progress
Analysis and Trading based on Envelopes, Waves, Cycles
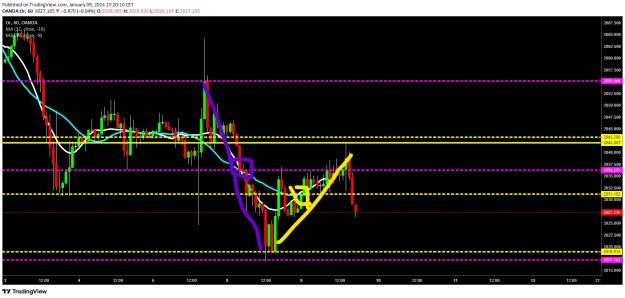
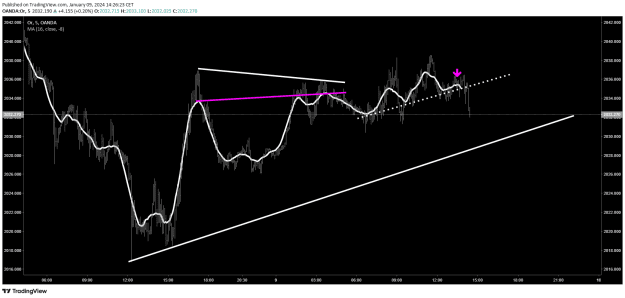
- Fractales replied Jan 9, 2024
image correction to my previous graph. If we do not take the candle wicks into account in the calculation and if we take into account the 10% margin of error we obtain more precise projections.
Analysis and Trading based on Envelopes, Waves, Cycles
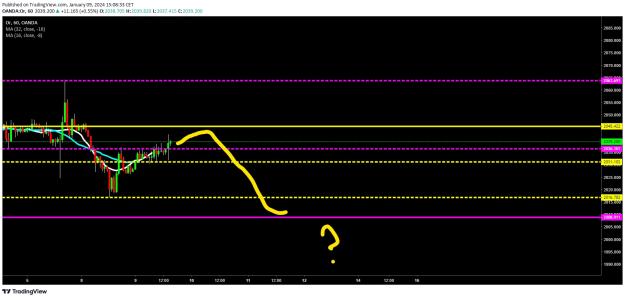
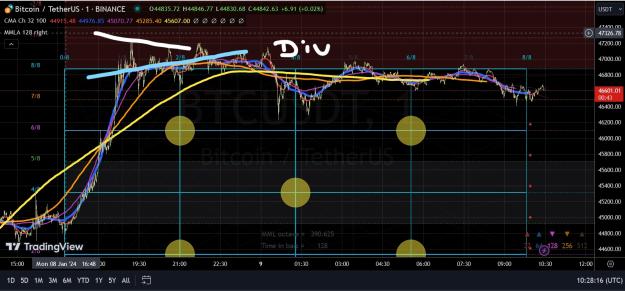
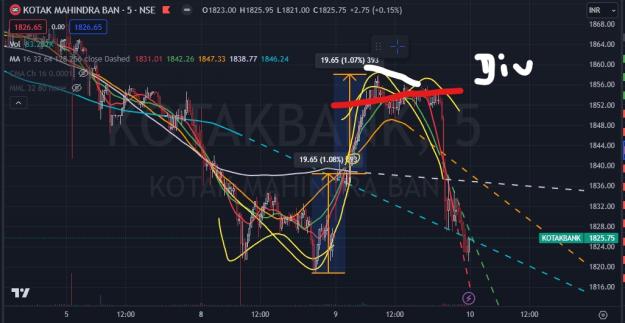
- Fractales replied Jan 9, 2024
image image Divergence between MA and Price
Analysis and Trading based on Envelopes, Waves, Cycles
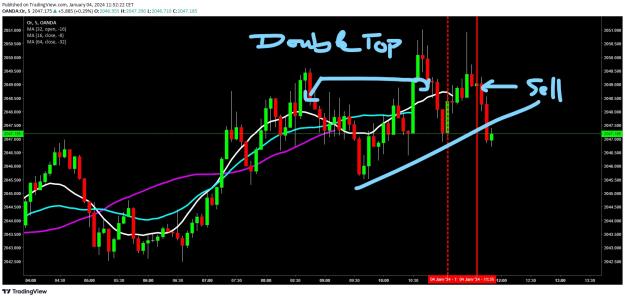
- Fractales replied Jan 4, 2024
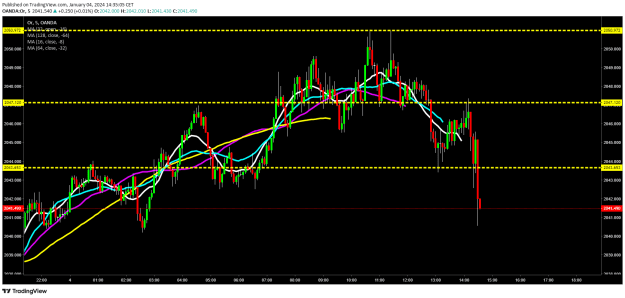
All MA down now image
Analysis and Trading based on Envelopes, Waves, Cycles
- Fractales replied Jan 4, 2024
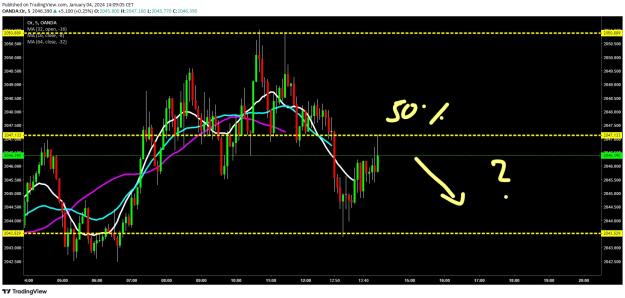
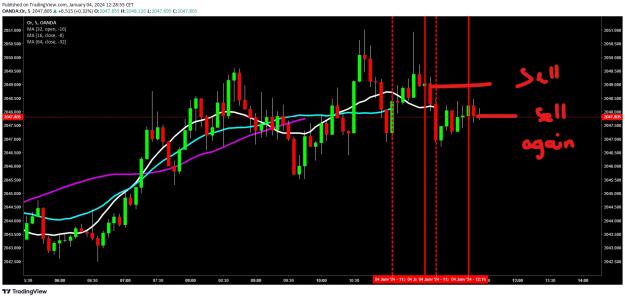
50% retracement? image
Analysis and Trading based on Envelopes, Waves, Cycles
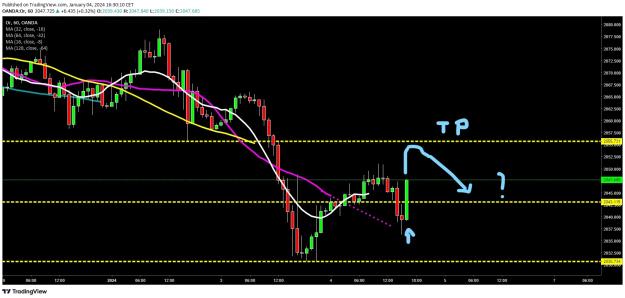
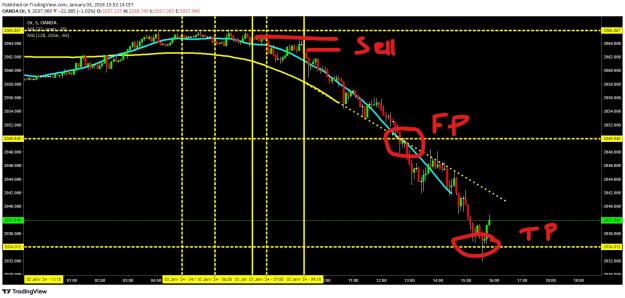
- Fractales replied Jan 4, 2024
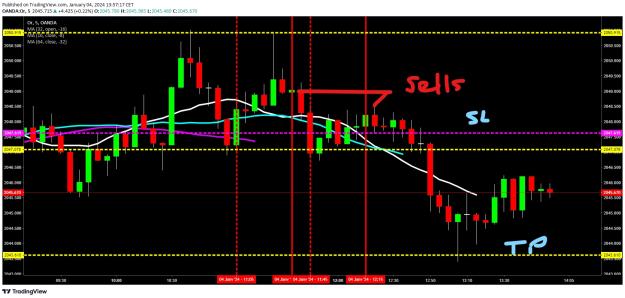
Thank you Parisboy, i hadn't seen it. SL was at BE (of second entry), not touch. TP reach. image
Analysis and Trading based on Envelopes, Waves, Cycles
- Fractales replied Jan 3, 2024
Hello and happy new year ! image
Analysis and Trading based on Envelopes, Waves, Cycles
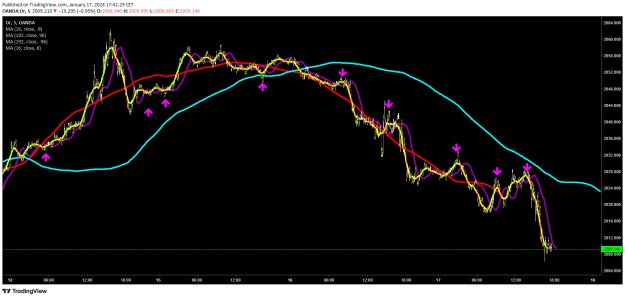
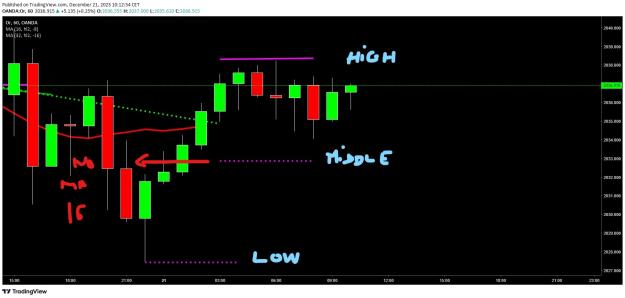
- Fractales replied Dec 21, 2023
assuming that the intersection of MA 16 and 32 constitutes a middle. Where are we on the graph below in real time? we have a high and a low with which I can calculate a midpoint. if we take up the hypothesis that this medium must be the crossing of ...
Analysis and Trading based on Envelopes, Waves, Cycles
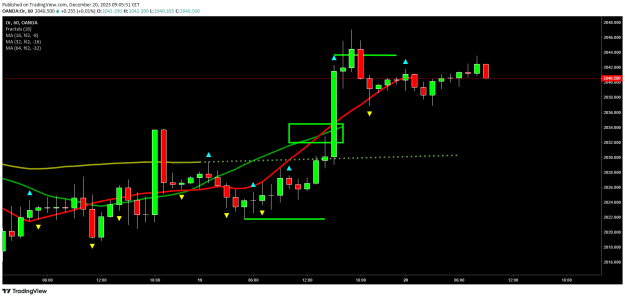
- Fractales replied Dec 20, 2023
After a cross, here MA 16, 32, the top is reach, then MA 32 is under MA 16 and projection of MA 64 is under MA 16 and 32, trend is down and start to form a bottoming of the cycle (only with MA 16 and 32)... you can enter a sell now ? or you wait ...
Analysis and Trading based on Envelopes, Waves, Cycles
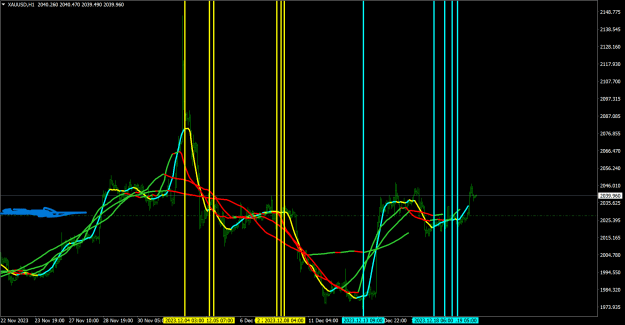
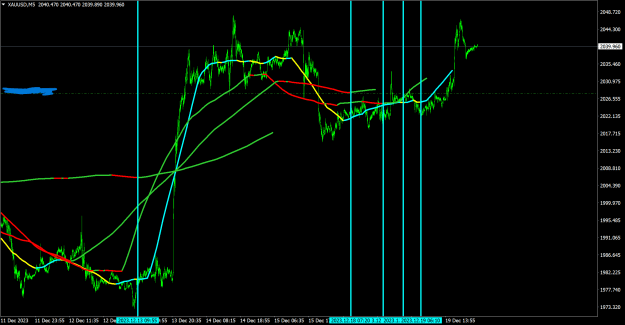
- Fractales replied Dec 19, 2023
5MN view with MA 60MN image
Analysis and Trading based on Envelopes, Waves, Cycles
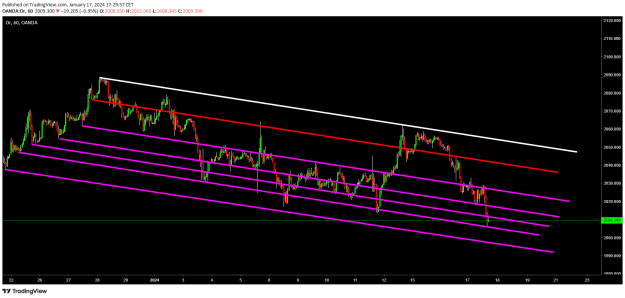
- Fractales replied Dec 19, 2023
with channel 32 image
Analysis and Trading based on Envelopes, Waves, Cycles
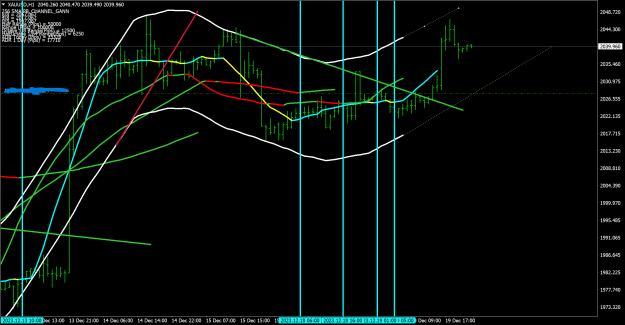
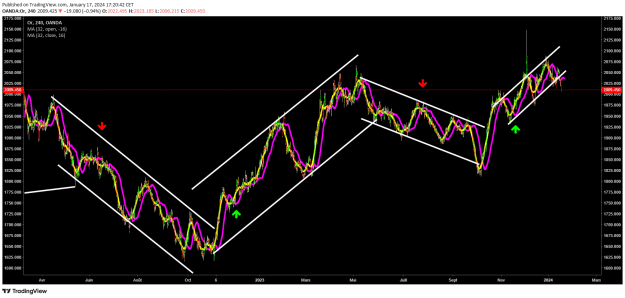
- Fractales replied Dec 19, 2023
with larger view; image
Analysis and Trading based on Envelopes, Waves, Cycles