- Search Forex Factory
- 9 Results
- Crnstone316 replied Jan 10, 2015
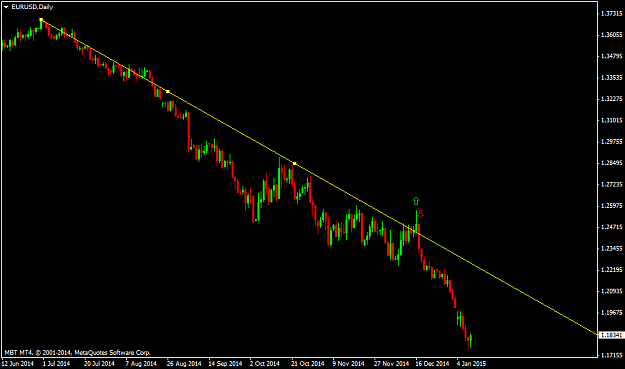
Reviewing the chart attached “naked chart” of the EURUSD (daily time frame) with a simple trend line drawn. The green arrow represents on 12/16/15 price broke above the trend line. For many retail traders that use technical analysis alone they would ...
Asking: Is there a strategy with low return (5-10% monthly)
- Crnstone316 replied Sep 7, 2013
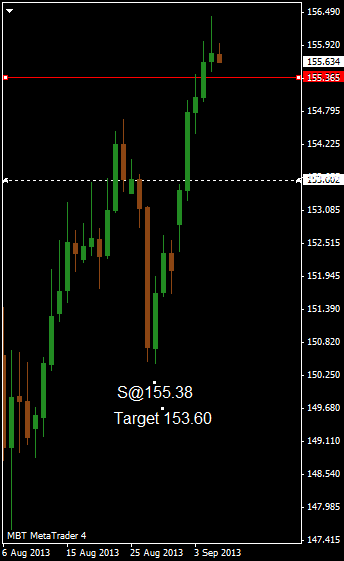
Here is an updated chart. Nice job sellers keep up the Great work
DailySniper

- Crnstone316 replied Sep 6, 2013
Here is a setup I am looking currently looking at: Short GBP/JPY at 155.38 (Red line) with a target at 153.60 (white dashed line).
DailySniper
- Crnstone316 replied Jun 28, 2013
I am unable to trade NZD/CAD and NZD/CHF because my broker does not support those pairs
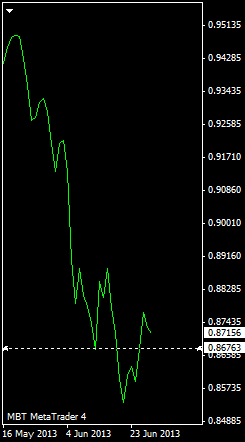
DailySniper , however I did look at AUD/CHF and CAD/CHF and thought they were too close to levels of support. See charts below. Any thoughts?

- Crnstone316 replied Jun 20, 2013
Here is a line chart, I am seeing 2 areas of support, however the risk/reward is not ideal from this view. Is there anything else you can shed some light on?
DailySniper

- Crnstone316 replied Jun 20, 2013
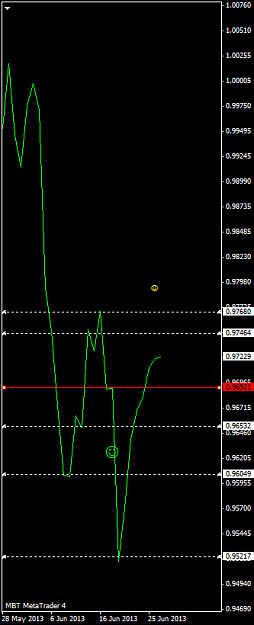
image The yellow line is an area I thought there was some support.
DailySniper

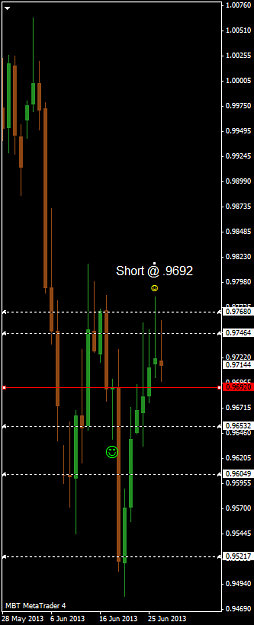
- Crnstone316 replied Jun 20, 2013
Here was the setup, green line was entry with white line as target.
DailySniper

- Crnstone316 replied Mar 5, 2010
The indicator just shows on the candle the trendline broken. I have drawn some white lines as examples of how the bars touch the lines and are rejected. Does this make sense? I have done some research since I last posted and I do not think it is ...
PAMA GannGrid System
- Posts by Member Search: 'Crnstone316'