- Search Forex Factory
- 21 Results (1 Thread , 20 Replies )
-
 Clusterwise replied Oct 5, 2007
no surprises today technical analysis discover the fundementals the result would be bad for the USD, don't buy USD Many thanks
Dollar up or down today

- Clusterwise replied Aug 20, 2007
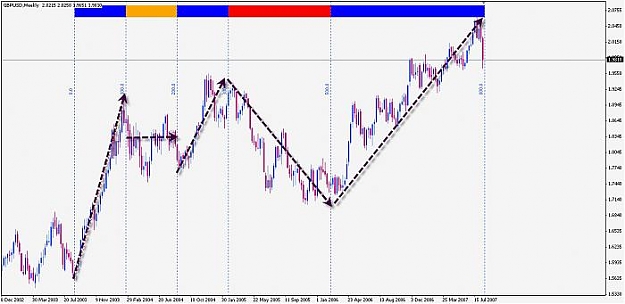
Hi elgrande sorry if i post the chart on this way, because i would like everyone to see the details over there The blue lines are fibo time zones, just give a look where will the retracement of this big cycle will end !!! as we finsih 5 cycles in ...
Elliott Wave Counting with EG
- Clusterwise replied Jul 30, 2007
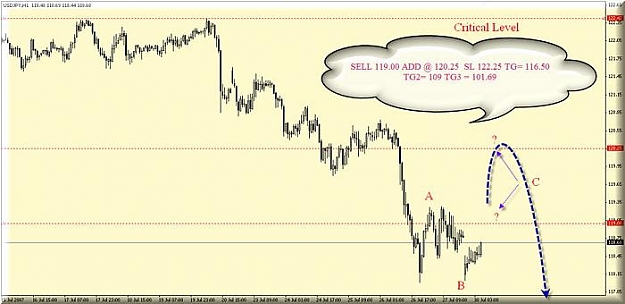
Good day all short from here 119.00 the target for short term traders 100 pips before 2:30 GMT 350 pips in less than two days the target for long term trade 109.00 then 101.69 Many thanks
USD/JPY Discussion
- Clusterwise replied Jul 30, 2007
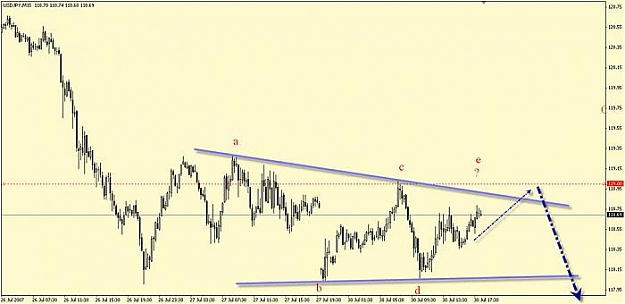
Golden chance become a diamond one — Good day all 1:00 Pm GMT passed and 118.00 hasn't been broken, but time always can tell so many words It's a Contracting triangl and if we look to the chart, it means that Asia session will have a very ...
End of Carry Trade

- Clusterwise replied Jul 30, 2007
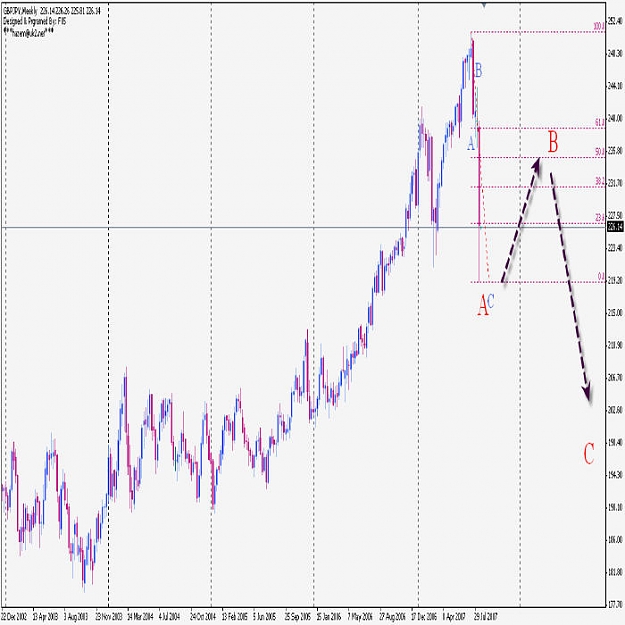
Thanks Gmak for ur nice analyses from my side SELL 119.00 , ADD 120.25 ST= 122.50 TG= 116.50 TG2=109.00 TG3=101.69 there is a possibility of truncation , so when the price reach 109 we will monitor the movement of the price good luck Many thanks
End of Carry Trade
- Clusterwise replied Jul 29, 2007
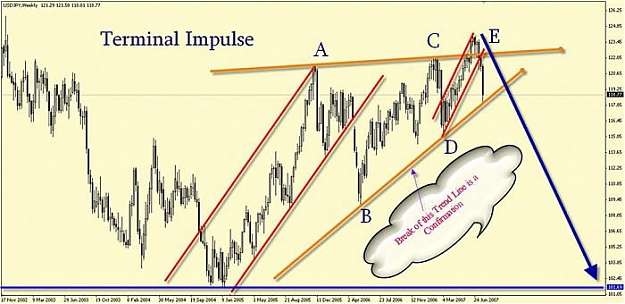
Does your wife know about terminal Impulse ??? Take a look to the leader USDJPY GBPJPY chart is not ready yet, I will post it as soon as I finish my calculations Many thanks
Daily GBP/JPY analysis
- End of Carry TradeStarted Jul 29, 2007|Trading Discussion|64 replies

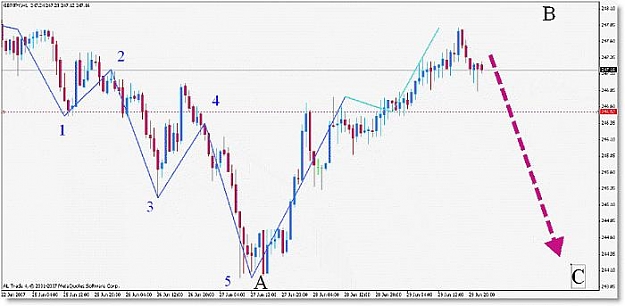
Good day all If I am right, it's the end of cary trade
 What do you think? Is it ...

- Clusterwise replied Jul 8, 2007
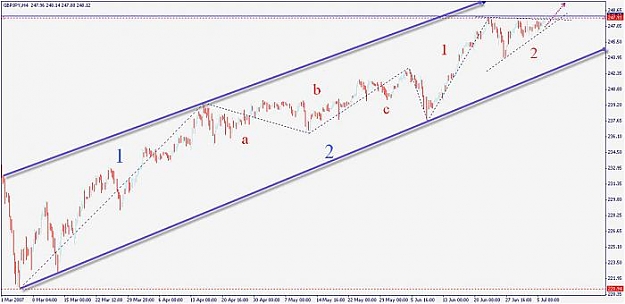
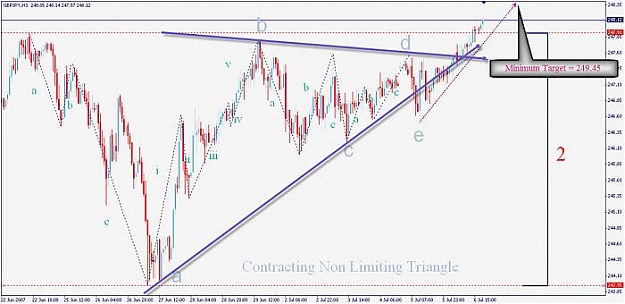
Good day all Buy atfer market open TG1= 249.45 TG2=250.45 TG3=260.00 ( Investors ) Stop Loss = 246.50 Good luck all
Daily GBP/JPY analysis
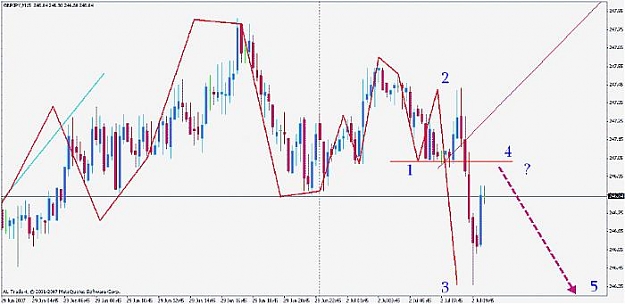
- Clusterwise replied Jul 2, 2007
Profit of today trade is 120 PIPS wanna see what elliot can do , look over there
Daily GBP/JPY analysis
- Clusterwise replied Jul 2, 2007
Okay I will repost the chart again
Daily GBP/JPY analysis Many thanks

- Clusterwise replied Jul 2, 2007
247.00 is critical point which should not be exceeded
Daily GBP/JPY analysis
- Clusterwise replied Oct 3, 2006
Hayyylllooo all This is GMT+3 on the track
Mouteki Trading I noticed among posts that people post here on this thread that GMT would give the most precise candels which trigger the signal of buying or selling, I appriciate if any one can give us a broker ...

- Clusterwise replied Oct 2, 2006
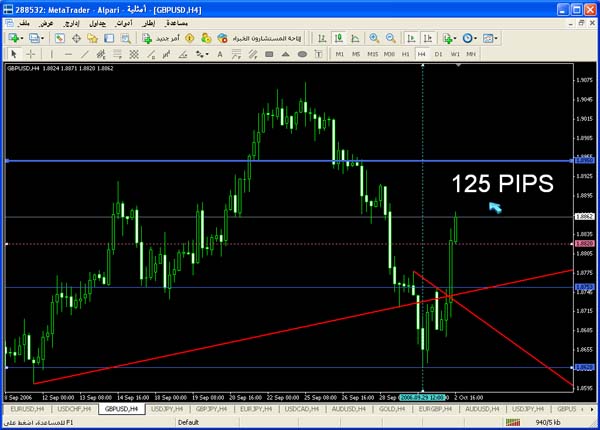
Hi there we might have a signal here and it supports my other signal in bound this give me big trust on this trade, let us see If the candel opened above broken trend BUY EURUSD at 1.2750 ( approximation ) TP= 1.2880 ( 130 PIPS ) SL= 1.2715 EUR IS ...
Mouteki Trading

- Clusterwise replied Oct 2, 2006
Hi dear actually when you look to the history of the chart you can notice that the pair sometimes goes up when ever touch them ( support points ) or goes down ( Resistance points ).
Mouteki Trading

- Clusterwise replied Oct 2, 2006
Hi again llambert3, you missed nothing
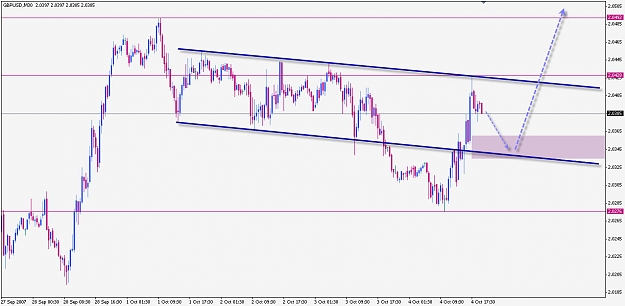
Mouteki Trading according to my signal BUY GBPUSD A 1.8820 TP= 1.8945 SL= 1.8750 It seems very precious week for the bound before it goes to 1.8300 
- Clusterwise replied Oct 2, 2006
I will show you live example which occured couple of minutes ago
Mouteki Trading

- Clusterwise replied Oct 2, 2006
Hi again IF I remove lines plus pic was zoomed It might help, please correct me if i am wrong, we call this strategy as the broken trend
Mouteki Trading

- Clusterwise replied Oct 2, 2006
Hayyylllooo all Hi Horace Kent I am still waiting my signal
Mouteki Trading
