- Search Forex Factory
- 15 Results
-
 Clansman replied Aug 26, 2008
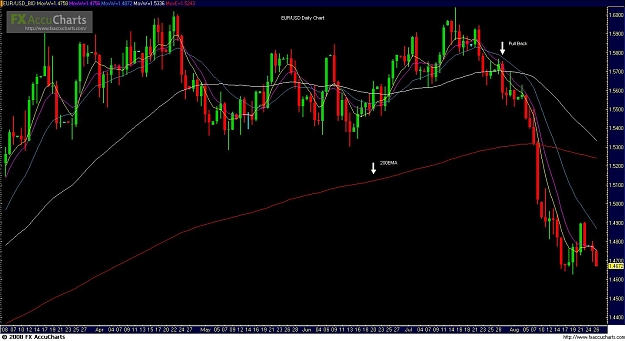
Daily Chart — Here's a daily chart with the CF ma's. The red ma is a 200ema. I use it for trend tracking. I hope it's helpful.
Cornflower Hourly System
- Clansman replied Aug 14, 2008
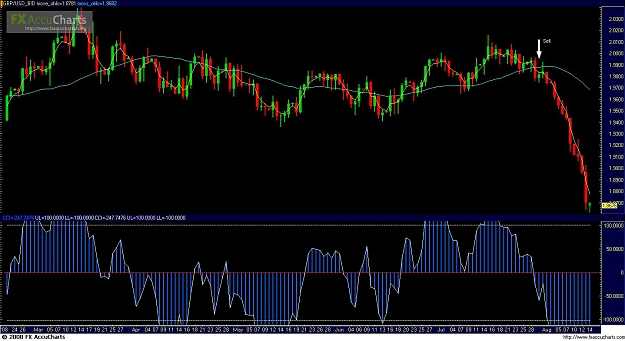
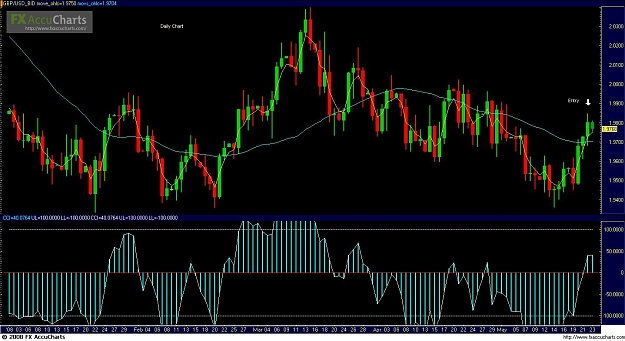
Not all currency pairs are ranging. I have attached the GBP/USD daily chart. Placing a sell order at 1.9786 on July 30 would have earned 1,084 pips by CoB New York market yesterday. Do not let yourself get locked into just one or two currencies or ...
Simplicity is the ultimate form of sophistication ( Elite )
- Clansman replied Jul 24, 2008
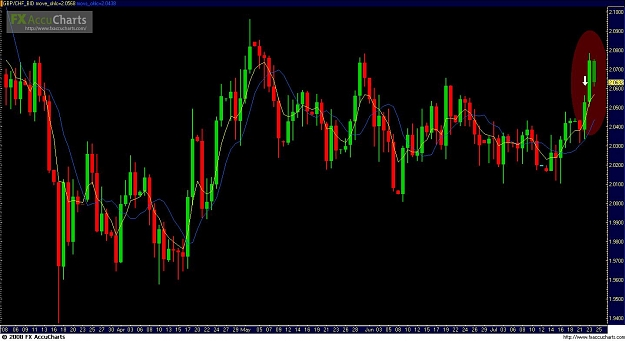
Why GBP/CHF? — Gambler180, You chose to buy the GBP/CHF on the 22nd (profiting a nice 250 pips.) Why did you choose to buy? On the chart below, I have marked the decision candle with an arrow. Your decision was correct for a nice profit, ...
Gamblers live trades
- Clansman replied Jul 21, 2008
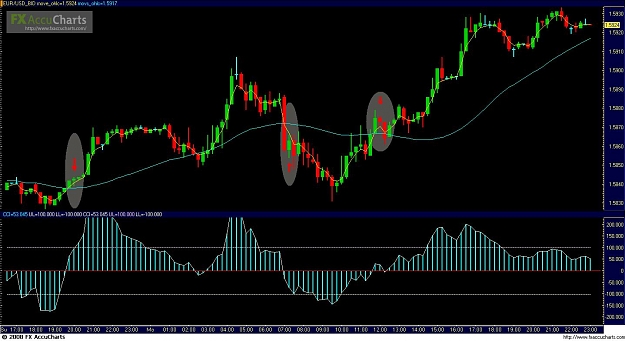
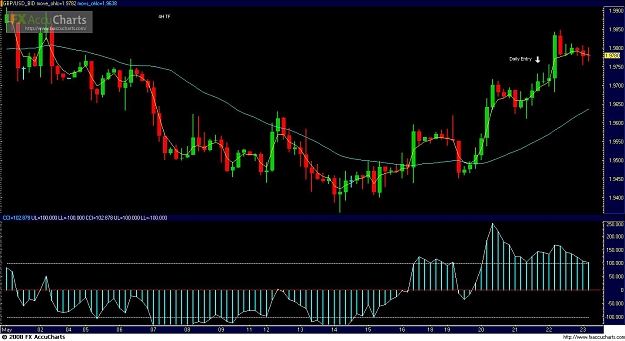
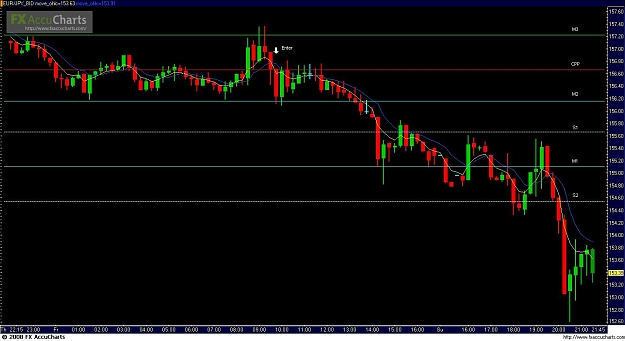
Maverick731 — I have taken that to mean the candle after the cross is the candle to make the entry decision on (see attached chart.)
Simplicity is the ultimate form of sophistication ( Elite )
- Clansman replied Jun 3, 2008
Re: Backtest. — T4L, I can appreciate the time involved in back testing. I have a couple of questions and a suggestion that might save some time with regards to the other pairs. On the 13 losses, when the 3ema crossed over, how many pips were ...
Simplicity is the ultimate form of sophistication ( Elite )
- Clansman replied May 23, 2008
While I can't tell you what will work for you, if you are using the 5M TF to determine your entry then add the 2M charts and forward test the combination. If it works for your eyes and you are trading profitably then stay with it. If not, then try ...
Simplicity is the ultimate form of sophistication ( Elite )
- Clansman replied Mar 18, 2008
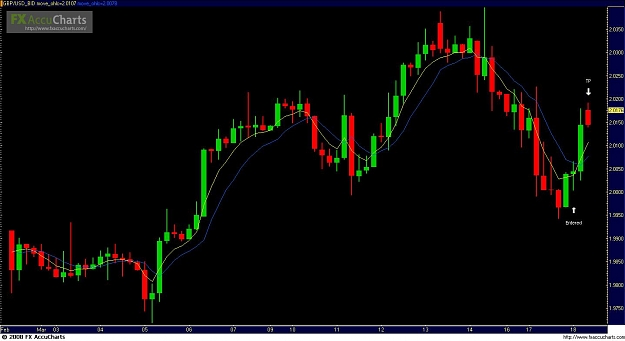
Another 4H test. — I'm still testing this on the 4H TF. On the GBP/USD I entered at 20038 at 0000 EST after the previous candle closed up. At 0830 EST I closed the trade at 20188 for 150 pips.
Gamblers 5 and 15 minute trading system
- Clansman replied Mar 16, 2008
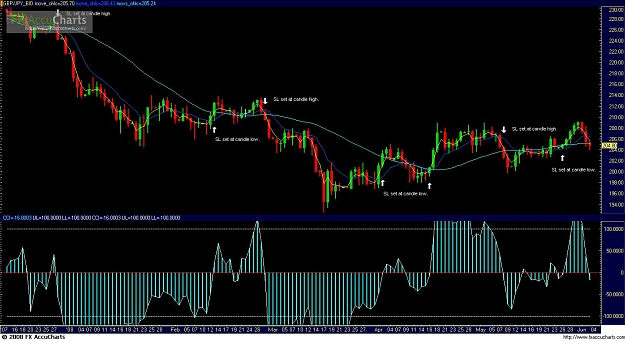
Should work on any pair. — This system is based on price action. Gambler180 uses an engulfing pattern (either Bear or Bull) to make the entrance decisions. Like M.A.C. Doug, I use pivots for S/R and determining exits. On the attached EUR/JPY ...
Gamblers 5 and 15 minute trading system
- Clansman replied Oct 16, 2007
That is a good guess, but I wasn't in the market at that time. My charts are set for Eastern Time, however, I live on the West Coast, and trade mainly the London session (although I do trade the Asian and New York sessions on an irregular basis.) I ...
Cornflower Hourly System
- Clansman replied Oct 16, 2007
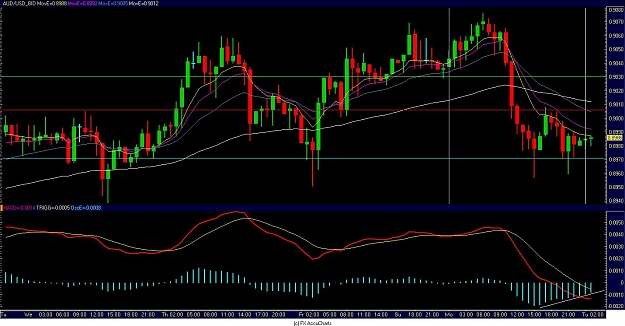
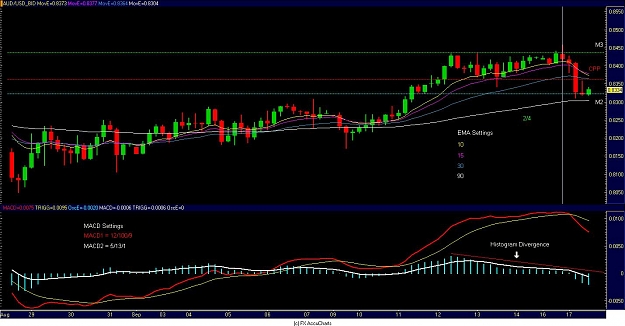
I'm watching it too. There is a histogram divergence showing a possibility for it to move upward. It is also bouncing off of my M2 pivot (see chart.)
Cornflower Hourly System
- Clansman replied Oct 15, 2007
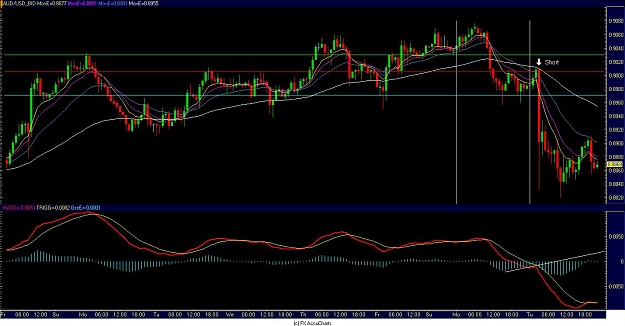
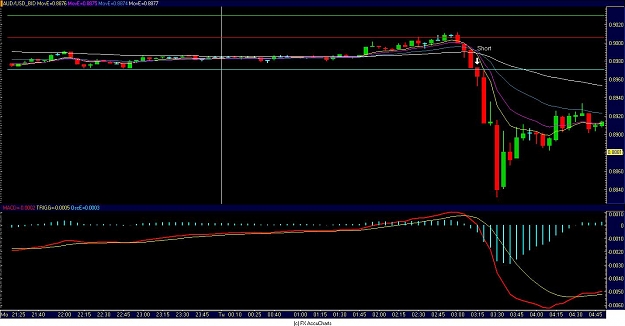
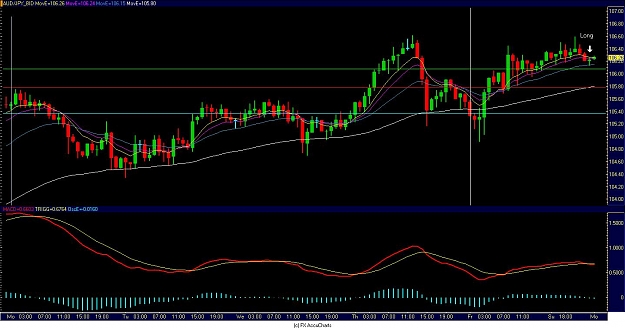
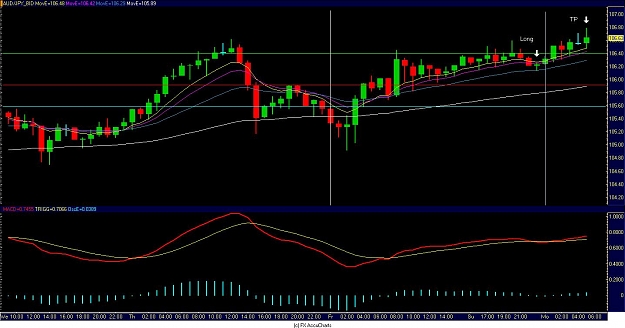
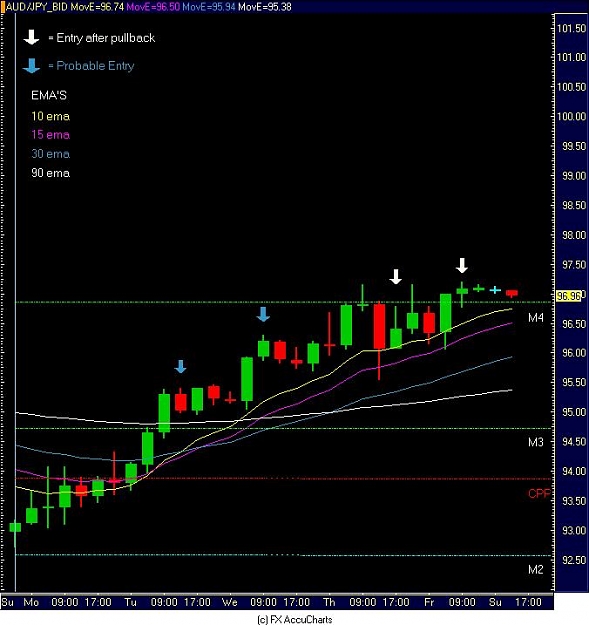
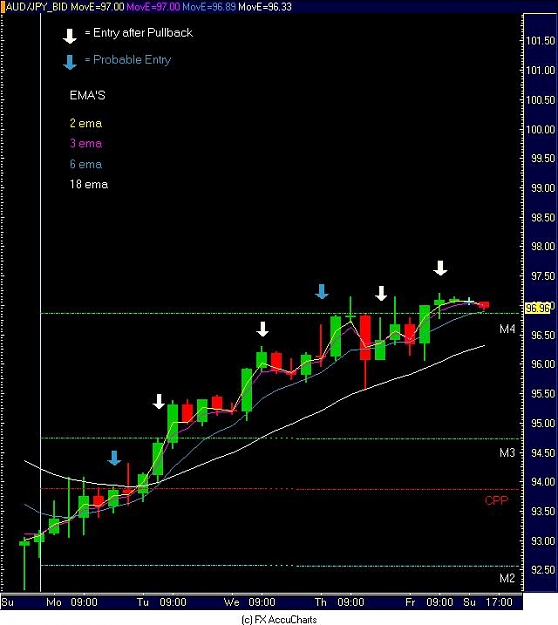
AUD/JPY trade. — Hello All, I thought this time I would submit two charts. The first is shortly after I placed the trade, and the second is when I exited the trade. I felt seeing how the chart looked shortly after the trade is placed, and then ...
Cornflower Hourly System
- Clansman replied Oct 12, 2007
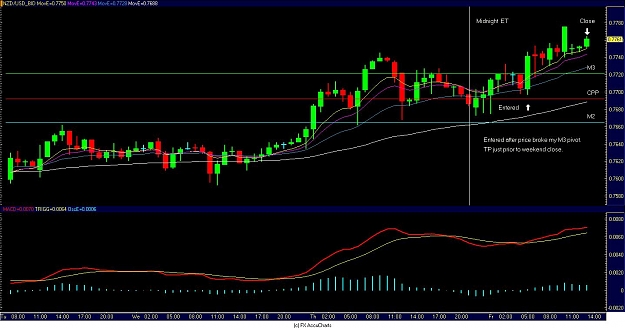
Hello All, It has been awhile since I posted a chart. Since this trade is a good example of a CF entry, I thought I would post it for anyone interested. I went long on the NZD/USD after price broke my M3 pivot. Since I do not like to leave trades ...
Cornflower Hourly System
- Clansman replied Sep 18, 2007
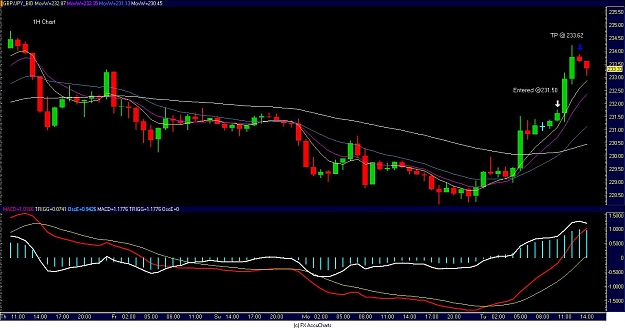
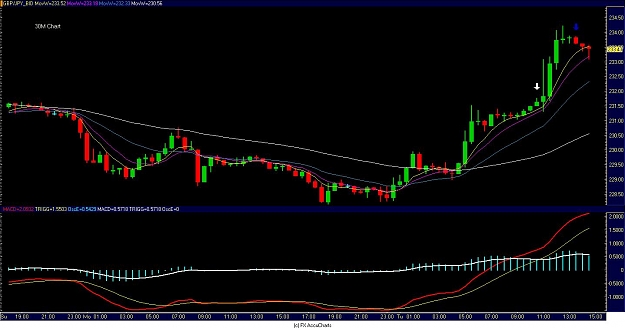
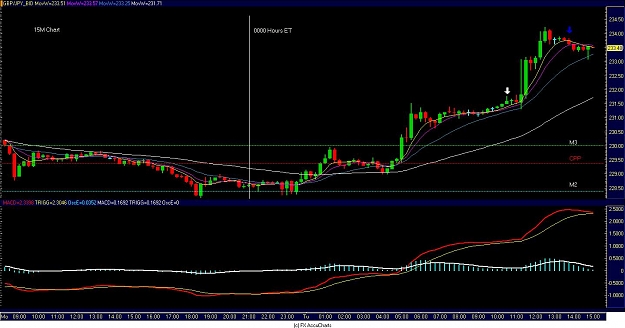
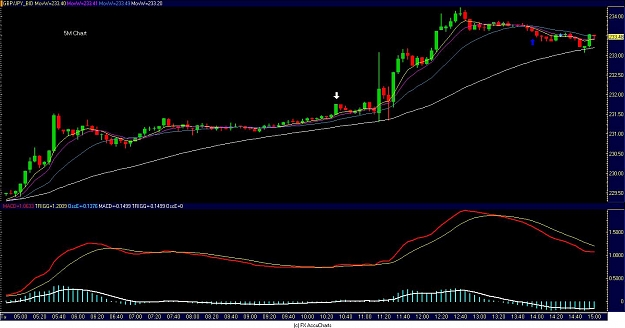
Cornflower Trade. — Hello All, I have attached the 1H, 30M, 15M, and 5M charts for a trade made today. Went long at 231.50 and TP at 233.62 on 5 lots. The white arrows mark the entry point and the blue arrows the TP on all four TF's. The MACD ...
Cornflower Hourly System
- Clansman replied Sep 17, 2007
4H TF Charts. — bullrock, After using the 4H TF charts with your ema settings side-by-side with mine, it became painfully obvious that my settings were to close together (gave me a headache looking at the chart.) In my early days, I used a ...
Cornflower Hourly System
- Clansman replied Sep 16, 2007
4H TF charts. — bullrock. I have attached 2 4H charts. The first is with your ema calculations based on a week period, and the second is with ema's calculated on a 24 hr period. My goal was to see if we could pick up moves earlier. My ema ...
Cornflower Hourly System
- Posts by Member Search: 'Clansman'