- Search Forex Factory
- 23 Results (1 Thread , 22 Replies )
-
 saoshyant replied May 15, 2018
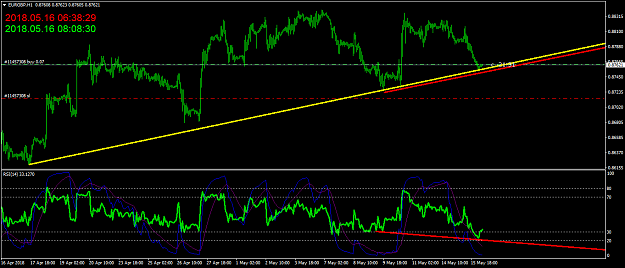
Hidden divergence on H1 + upward support as you can see, suggesting another uptrend move.
EURGBP
- saoshyant replied May 15, 2018
USDJPY H1 4 trades on multi divergence.
Multiple Divergencences in a row

- saoshyant replied May 15, 2018
AUDJPY M30 3 trades on multi divergence.
Multiple Divergencences in a row

- saoshyant replied May 15, 2018
Strong daily resistance at 110.25 touched now, Which is 127% of previous bearish trend.
USD/JPY Discussion

- saoshyant replied May 15, 2018
Does this look like the channel is broken upward, Sir?
GBPJPY moving in a channel

- saoshyant replied May 14, 2018
Hello guys, I need to add an alert into a system in which 2 indicators reach a certain criteria. (both should be met in order for the alert to show up) 2 conditions are: 1. RSIOMA Light is below 20% 2. Advanced ADX changes trend, which is indicated ...
I will code your EAs and Indicators for no charge


- saoshyant replied May 14, 2018
Also you can see the same results in EURUSD. The circles are entry points, the yellow vertical line is the exit which is confirmed by AA trend (down bottom rectangle), also 38% of fibo ret and RSIOMA in 20-30%.
Multiple Divergencences in a row

- saoshyant replied May 14, 2018
AUDUSD results: 3 trading points: the first with +60pips, the second with around +250 pips and the third around +300pips. You see that AA signal happened around 23% fibo ret. Also RSIOMA under 20-30%, all of which shows our exit point.
Multiple Divergencences in a row

- saoshyant replied May 13, 2018
AUDUSD is forming some MD on H1 now. Waiting for it to unfold. RSIOMA in overbought First TP on 50% fibo ret which is the previous bottom support Waiting for AA to confirm exit.
Multiple Divergencences in a row

- saoshyant replied May 13, 2018
Gold Exit at 1 for lower risk Confirmation by RSIOMA and bigger profit at 2 (also bigger risk)
Multiple Divergencences in a row

- saoshyant replied May 13, 2018
Another example on EURJPY : You can see in order to avoid risks you could have exited all trades at point number 1. However, confirmation from RSIOMA came later at 2 (bigger profits)
Multiple Divergencences in a row


- saoshyant replied May 13, 2018
Another USDJPY example: Same rules. In this example we see a weak signal which only went back to touch 38% level but still all trades were in profit.
Multiple Divergencences in a row


- saoshyant replied May 13, 2018
The next example: The gray circles are entry points. The yellow line is the exit. (which is 50% ret, 20-30% RSIOMA and First trend reverse in AA)
Multiple Divergencences in a row

- saoshyant replied May 13, 2018
I will now demonstrate a number of examples in order to clarify this strategy. Remember our first example on GBPJPY. Now look at the first photo below. The light green vertical lines are the trade entry points. As you can see multiple divergences ...
Multiple Divergencences in a row


- saoshyant replied May 8, 2018
Can someone explain this daily chart to me please??? It's been 21 daily candles now without a proper correction!
USD/CHF

- saoshyant replied May 7, 2018
As for illustrations, you may check these:
Multiple Divergencences in a row


- Multiple Divergencences in a rowStarted May 2, 2018|Trading Discussion|75 replies

Hello guys. One simple question. What do you think of multiple divergence that are shaping after ...

