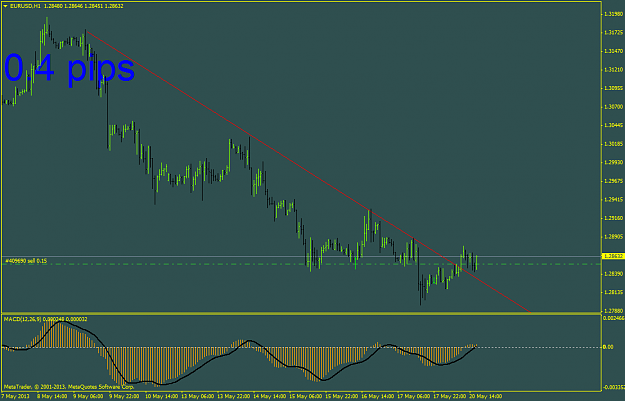
image This chart is an hourly chart over a two week period. Over that two week period the hourly chart is in a subjective down trend (a series of lower lows and lower highs) . Am I right to go short on this subjective down trend? Maybe the ...