- Search Forex Factory
- 63 Results
-
 numbnuts replied Dec 29, 2018
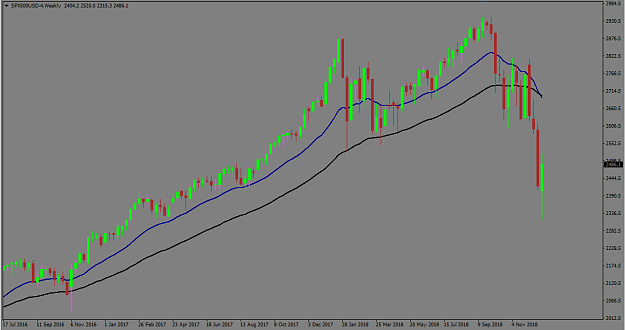
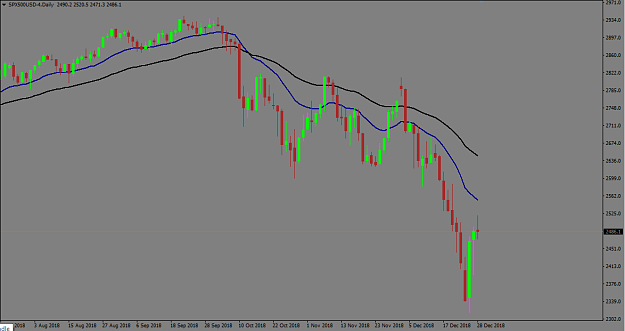
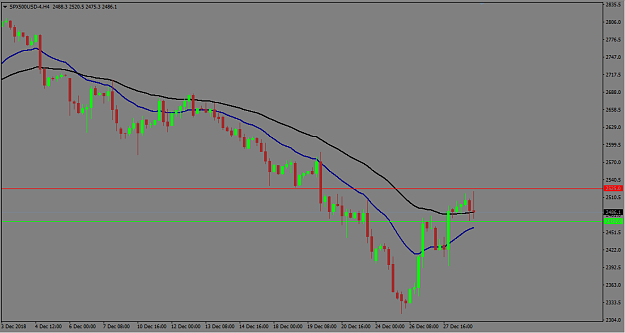
Here's one I've been waiting a long time for. SPX500 has been supported for a long time by very loose monetary policy from the fed. Now QE has ended and the Fed has started to raise rates, the SPX500 has moved into a downtrend on the weekly: image ...
Advanced TST
- numbnuts replied Jun 1, 2016
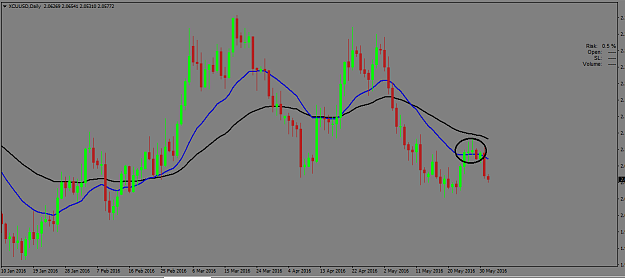
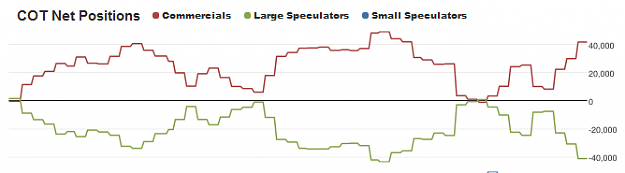
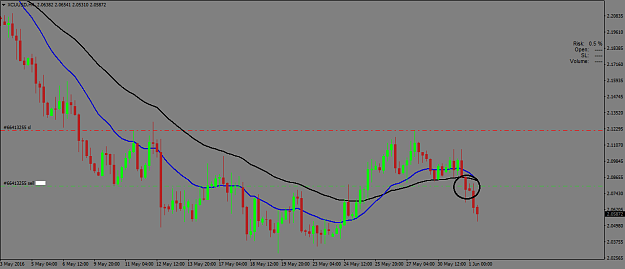
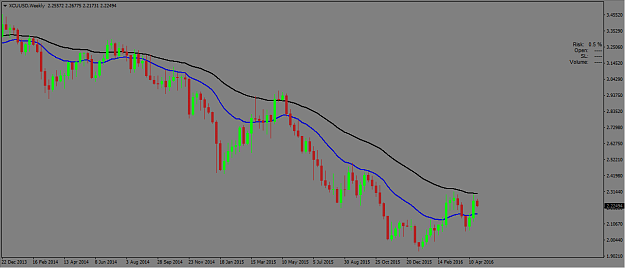
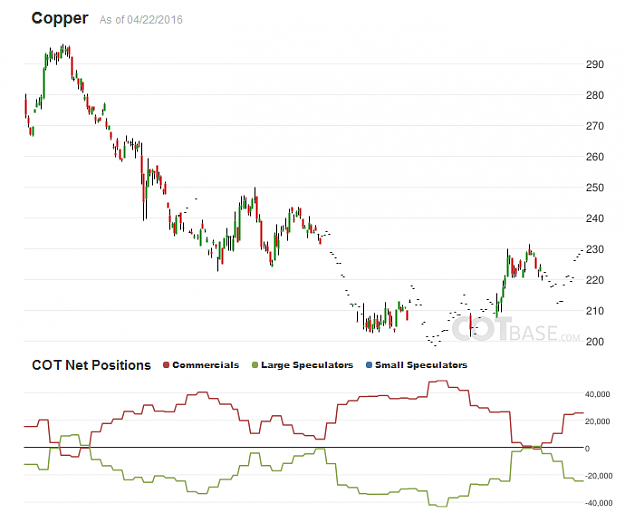
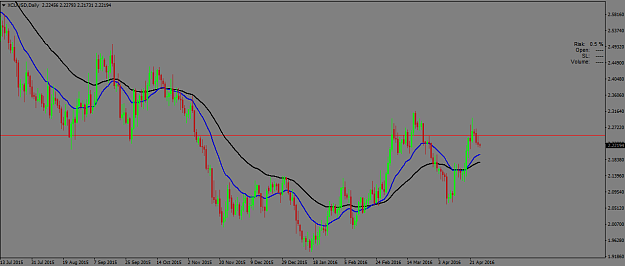
Short copper again. Weekly is trending down: image The Daily made a pullback to the 20EMA, but COT showed big speculators still selling: image image Breakout entry on the 4H: image
Advanced TST
- numbnuts replied Jun 1, 2016
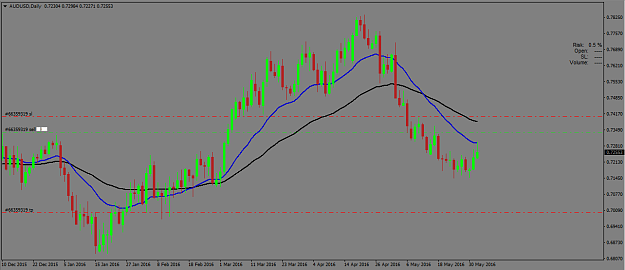
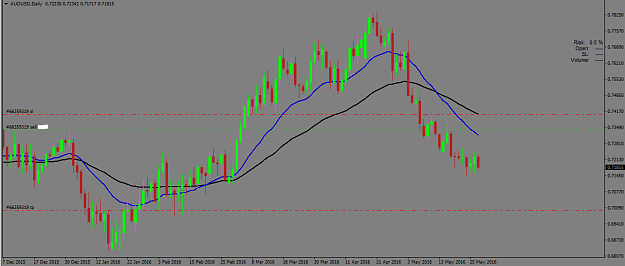
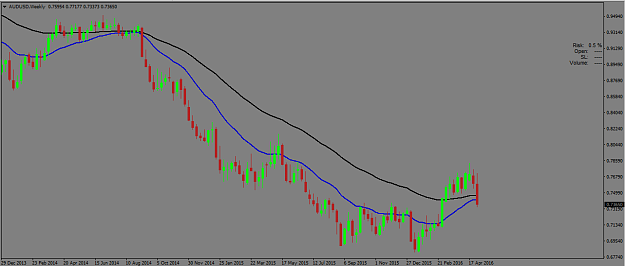
Aussie GDP Growth came in higher than expected today which didn't do my AUD/USD short any good ..... but the daily has pulled back to the 20EMA and the RBA is still threatening to cut rates again while the Fed is talking hikes, so if the pullback ...
Advanced TST
- numbnuts replied May 27, 2016
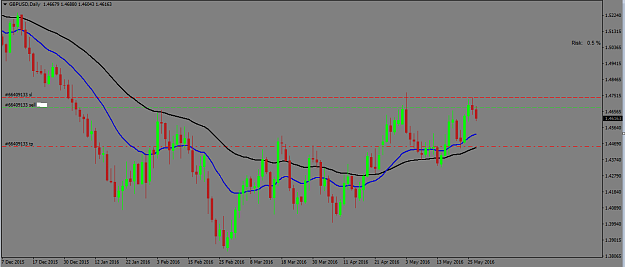
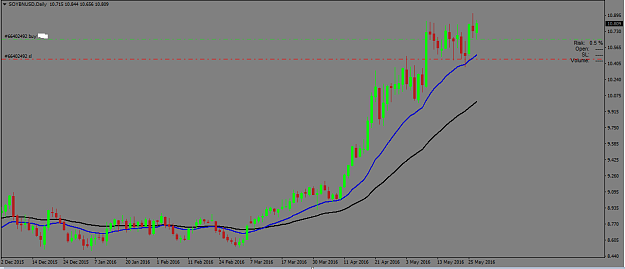
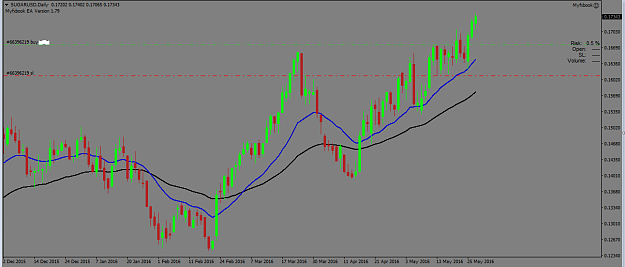
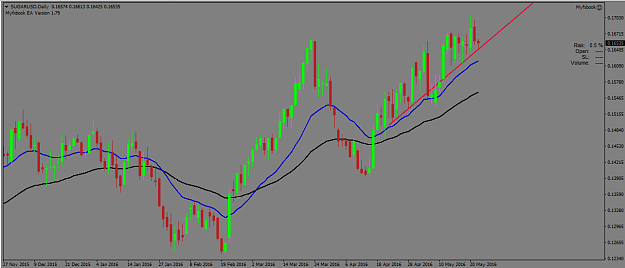
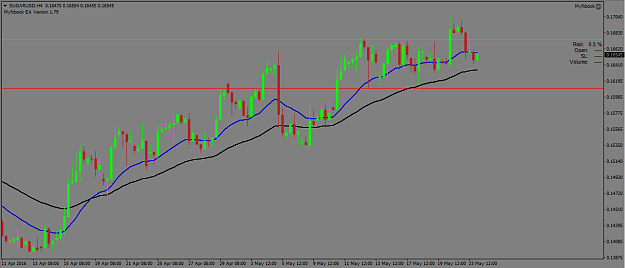
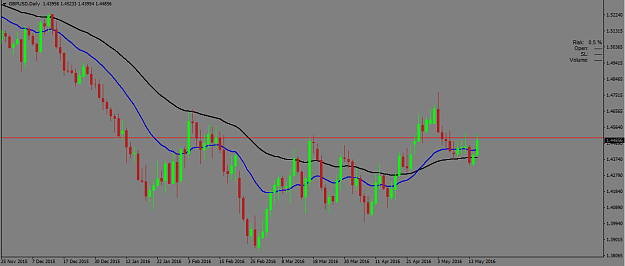
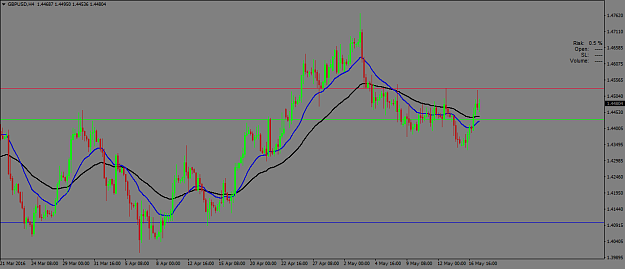
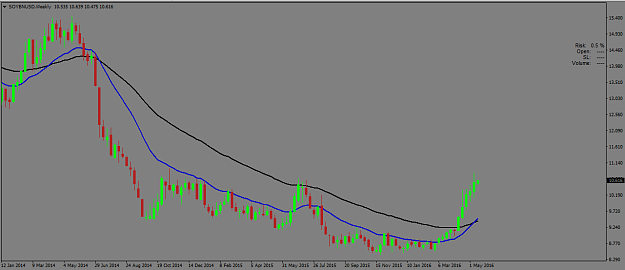
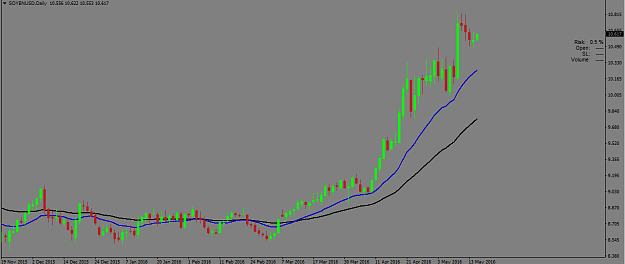
Four trades open going into the weekend. Short GBP/USD: image Short AUD/USD: image Long Soybeans (target 12.00) image Long Sugar (target 0.18) image Have a good weekend
Advanced TST
- numbnuts replied May 25, 2016
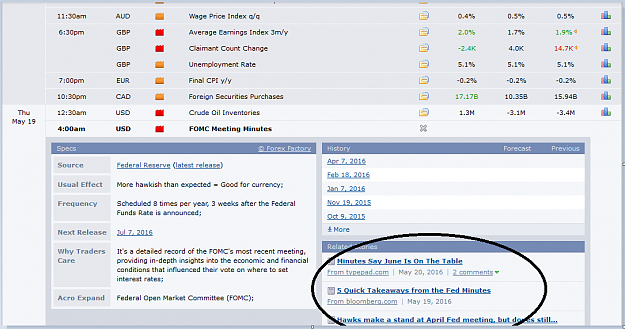
That's correct .... The US fed is hiking rates, and the Bank of Japan is cutting rates, which is a BUY signal on USD/JPY - but USD/JPY is still trending down on the weekly, so there is no trade opportunity there. (Always trade with the trend). I'm ...
Advanced TST
- numbnuts replied May 24, 2016
I've been watching sugar too. Last week there was never really a decent pullback on the daily to get long, but it looks promising with a lot of higher highs and higher lows hovering on or above the daily 20EMA. There is a pullback of sorts happening ...
Advanced TST
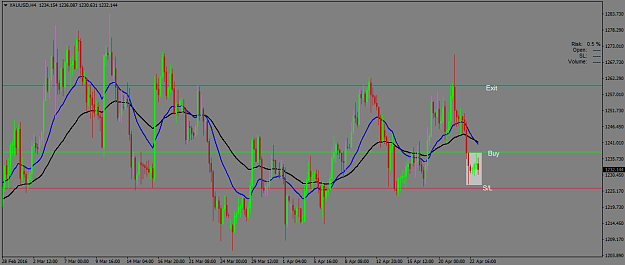
- numbnuts replied May 20, 2016
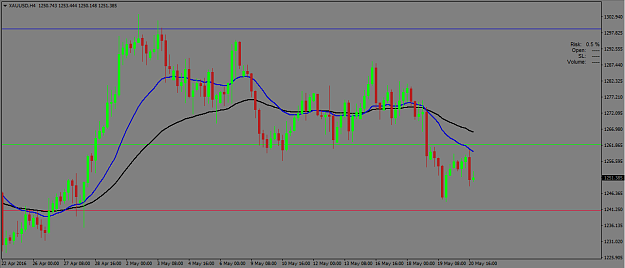
Hi kaboemm I think you've nailed it man, I have the same order in place. I have a buy order at 1262 S/L at 1241 (below support) TP at 1299 (before significant resistance) It doesn't matter so much if your entry and exit levels are slightly different ...
Advanced TST
- numbnuts replied May 17, 2016
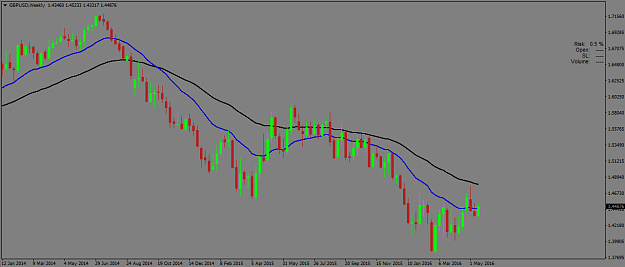
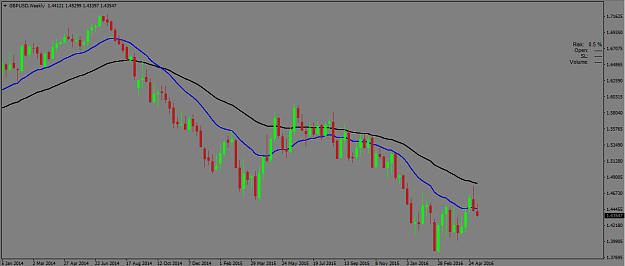
GBP/USD. As explained in previous posts I'm fundamentally bearish GBP and fundamentally bullish USD. Weekly chart is signalling a downtrend: image Daily chart shows a shorter term pullback, but the reasons for the downtrend are still in play: BOE ...
Advanced TST
- numbnuts replied May 17, 2016
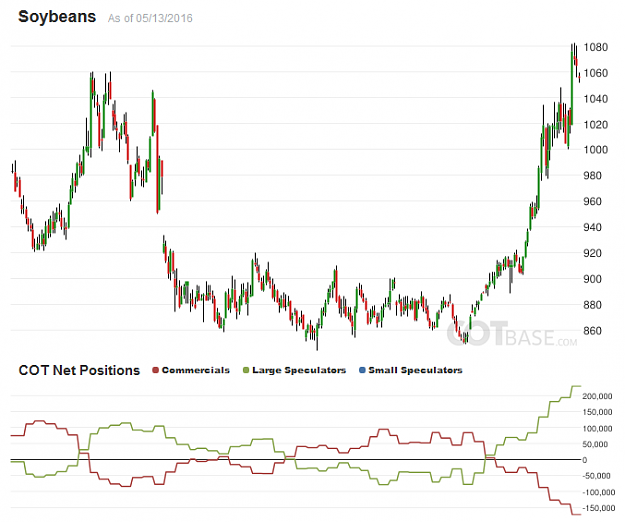
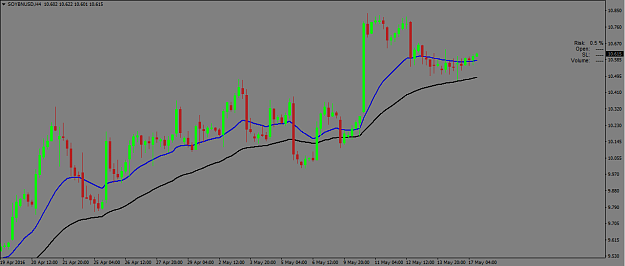
Soybeans. Weekly chart is signalling an uptrend: image Daily is showing a pullback against the weekly trend, but COT shows large specs still bullish: image image 4H chart shows a bunch of inside bars/sideways movement: image Will enter if ...
Advanced TST
- numbnuts replied May 15, 2016
I'm getting very bearish on GBP as the Brexit vote nears ..... I'm already short and with 5 weeks until the vote I plan on adding GBP shorts for the next four weeks then flattening the positions before the referendum. Buy the rumor, sell the fact. ...
Advanced TST
- numbnuts replied May 9, 2016
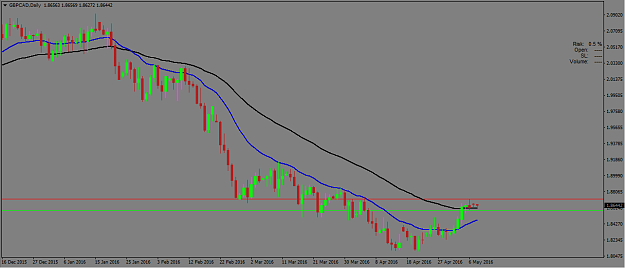
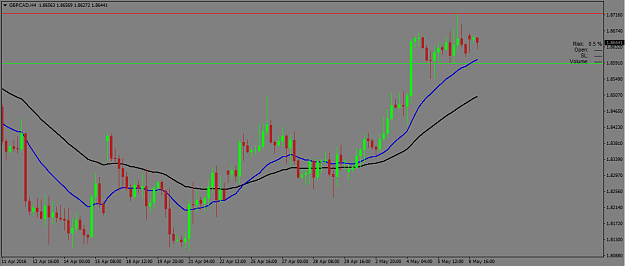
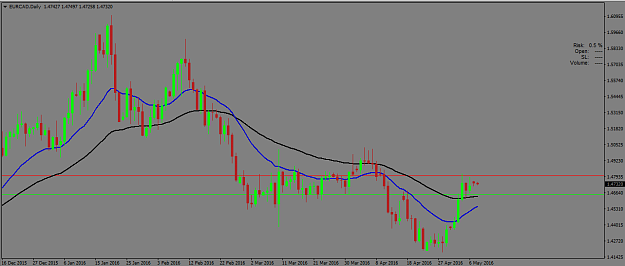
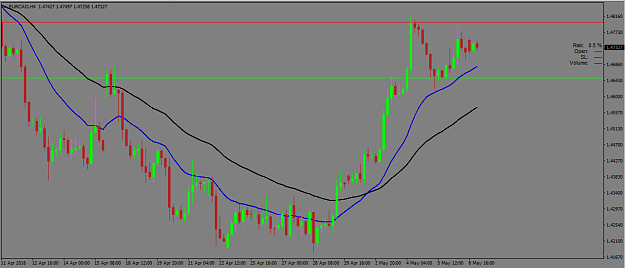
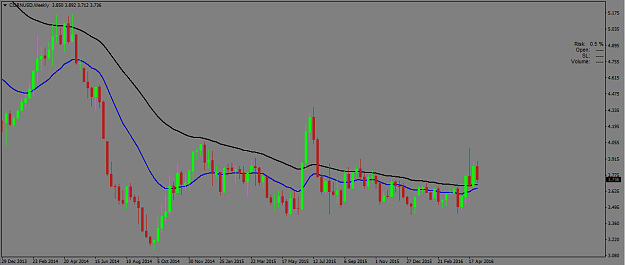
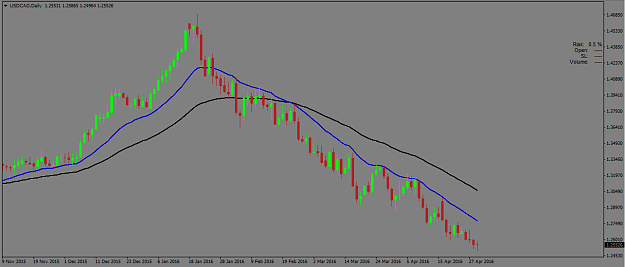
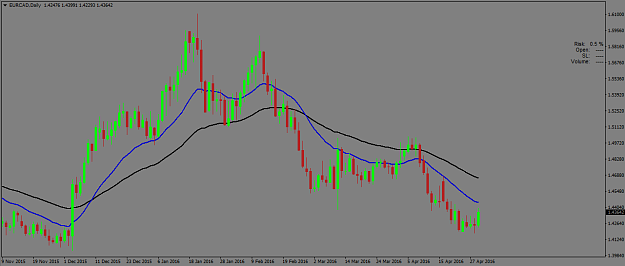
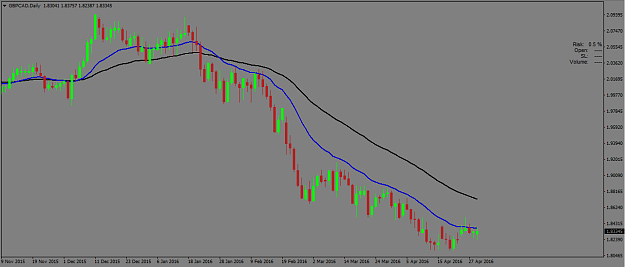
Hi KoiFish Yeah I've definitely stopped looking for any short USD positions after Dudley's comments about rate hikes. EUR/CAD and GBP/CAD have both pulled back on the daily, and both 4H charts are showing a bunch of inside bars so I have short ...
Advanced TST
- numbnuts replied May 9, 2016
Hi jpch I have some rules for trends, but there is some discretion involved too. To me a trend isn't just technical, it's also fundamental. On longer term TFs like the weekly, I kind of see them as the same thing - a technical trend is nothing ...
Advanced TST
- numbnuts replied May 7, 2016
RBA cut rates to record low this week and threatens to cut again if inflation doesn't start picking up. The cut was a surprise, predicted by only 12 of 27 economists surveyed "RBA remains on hold and are prepared to ease further if necessary" - J ...
Advanced TST
- numbnuts replied May 4, 2016
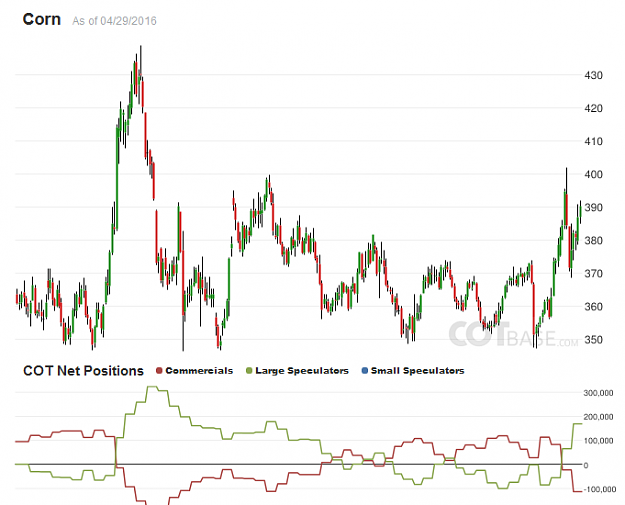
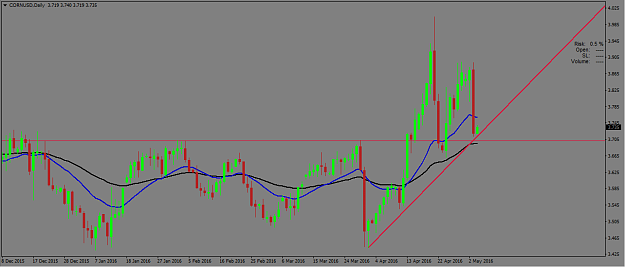
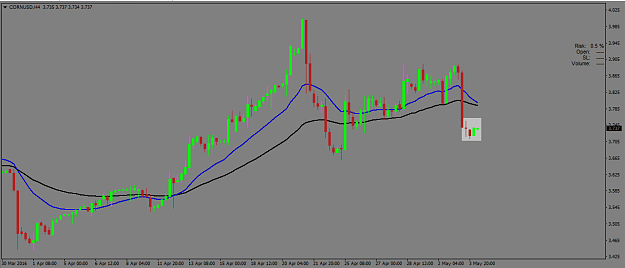
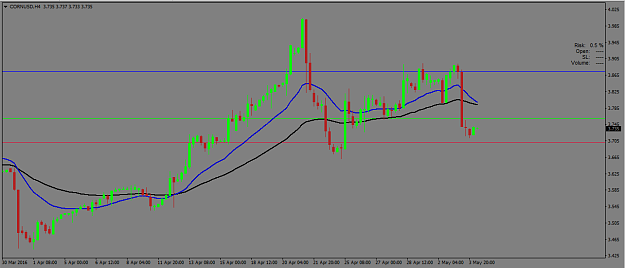
Corn. Weekly chart has broken above its moving averages, as large speculators accumulate: image image Daily chart shows a nice pullback to the trendline, also a recently significant S/R level, but COT hasn't indicated that the fundamentals may ...
Advanced TST
- numbnuts replied May 1, 2016
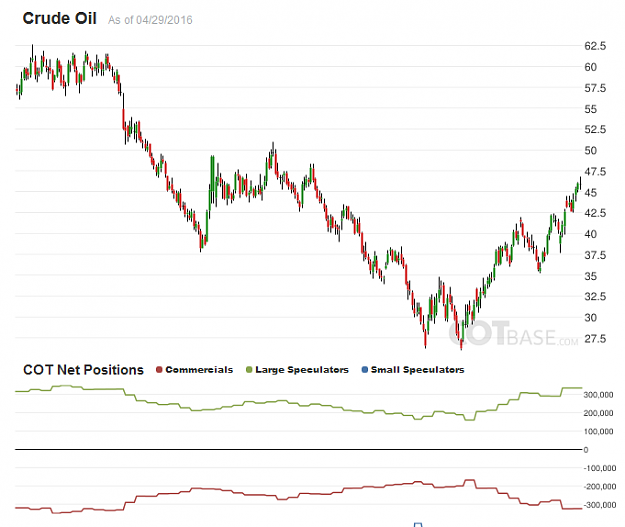
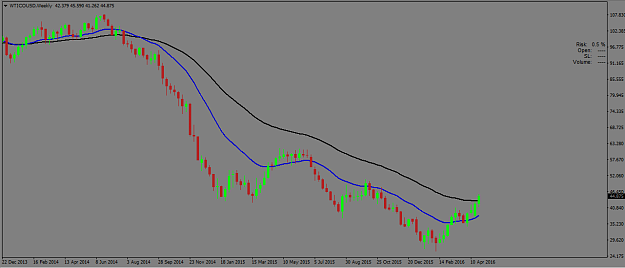
Crude Oil has found some consistent strength recently. Large Speculative positions are still net long and don't look to be selling off: image I'm not looking for long positions yet though, since the weekly WTI chart isn't showing an uptrend. ...
Advanced TST
- numbnuts replied May 1, 2016
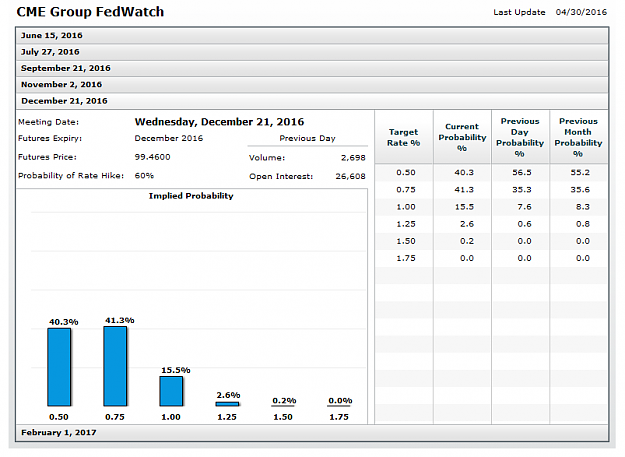
Some hawkish tones starting to come from USA again ...... Futures markets are pricing in a 60% chance of at least one rate hike by December: image The chatter has become decidedly less dovish in the last few weeks: "Heightened global risks and the ...
Advanced TST
- numbnuts replied Apr 27, 2016
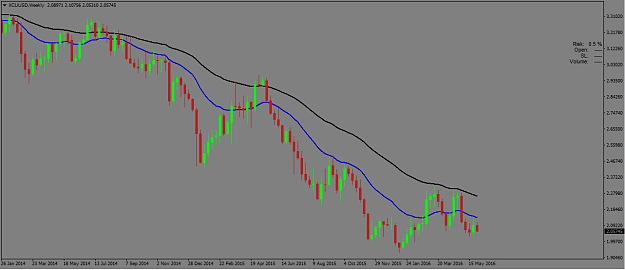
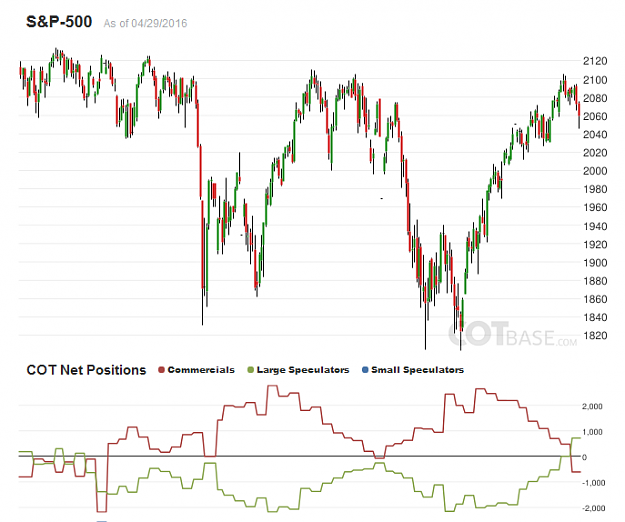
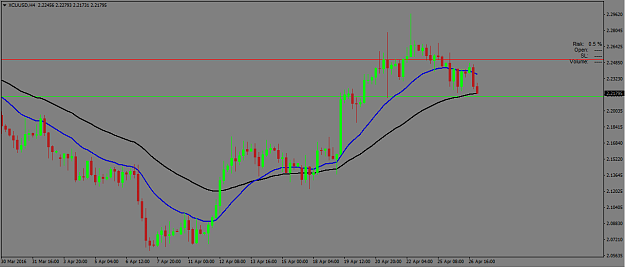
Copper again. Weekly chart still shows a downtrend. COT shows large speculators short and still selling: image image Daily chart shows a pullback .... to around 2.25, a significant round number which price has respected several times in the ...
Advanced TST
- numbnuts replied Apr 25, 2016
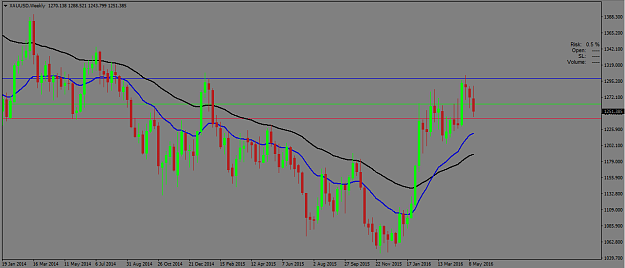
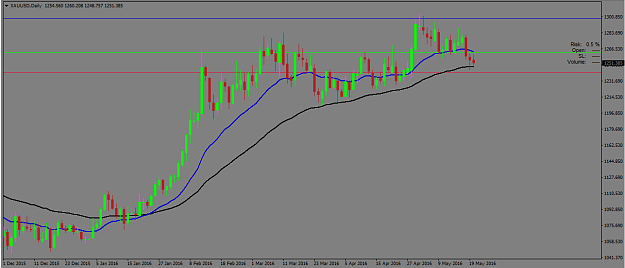
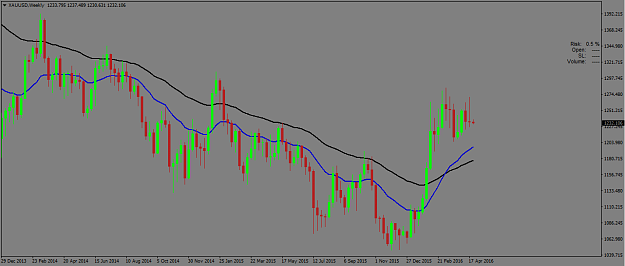
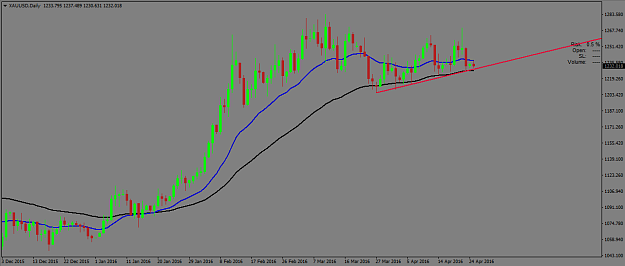
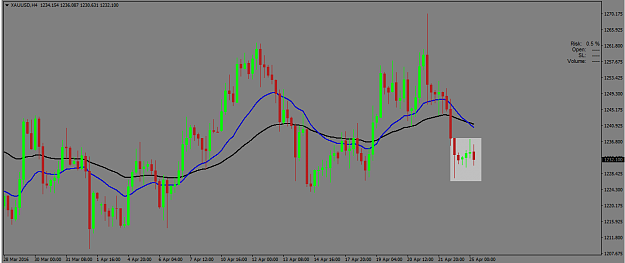
Gold .... Weekly trend is up, all major central banks are simultaneously making dovish remarks: image Daily has pulled back to support, but the fundamental reason for the weekly trend hasn't changed: image 4H chart shows a bunch of inside bars, ...
Advanced TST
- numbnuts replied Apr 21, 2016
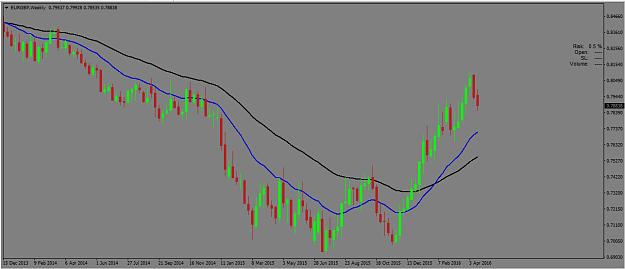
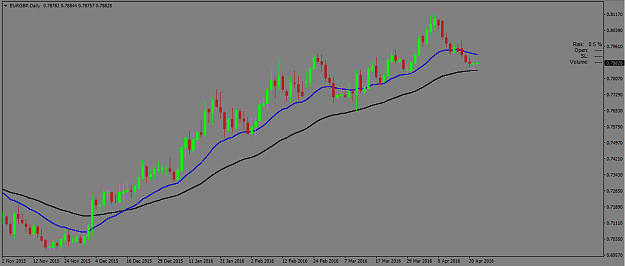
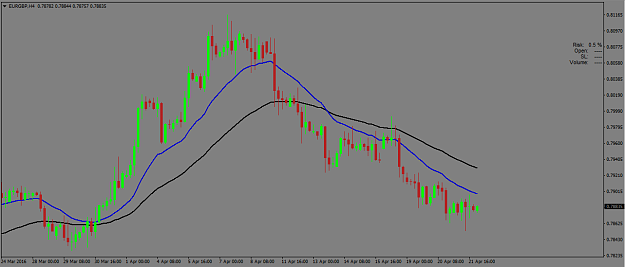
EUR/GBP has been trending higher on the weekly chart: image The trend is caused by a few things: - Increasing threat of Brexit - ECB implying that more easing may not be needed - BOE pulling back from it's previous hawkish position, downgrading ...
Advanced TST

- numbnuts replied Apr 19, 2016
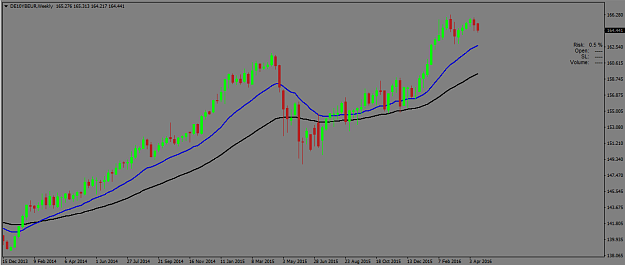
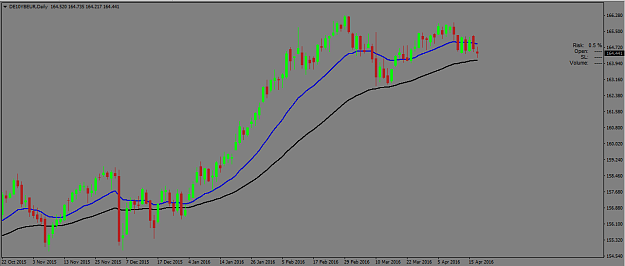
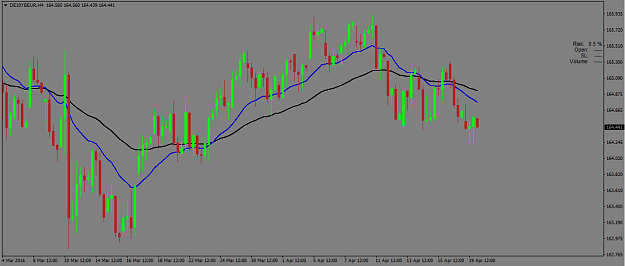
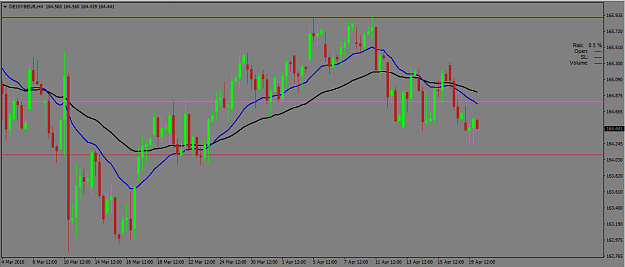
German Bund (DE10YBEUR) has been trending higher on the weekly chart: image On the daily chart, price has pulled back to the 50-day ema, which it has respected before: image But ECB is still printing money, indicating more strength in the Bund. ...
Advanced TST