- Search Forex Factory
- 118 Results
-
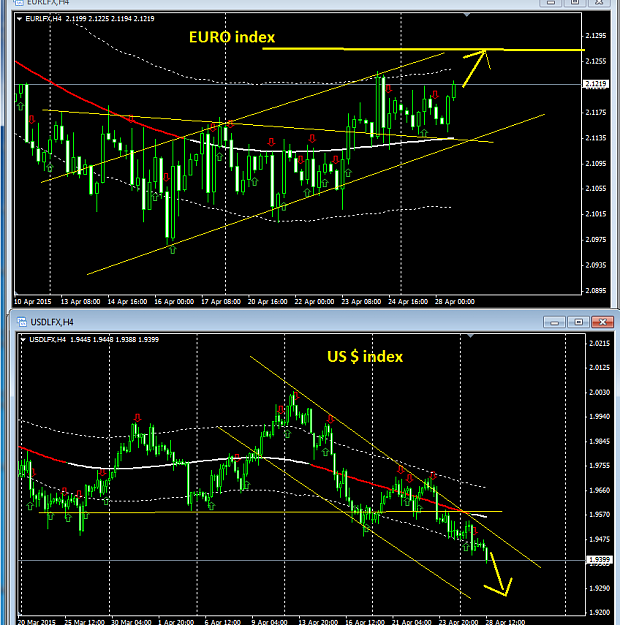
 leekaq replied Apr 28, 2015
there is still some momentum for EU to go up,,, based on the indexes,,,holding my buy,,,TAYOR
EURUSD
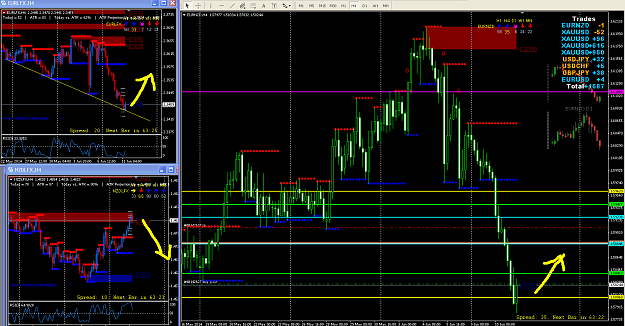
- leekaq replied Jun 11, 2014
EJ buy, GJ buy, Euro-NZD buy....TAYORRRR
CICR system (Currency index cross referencing)
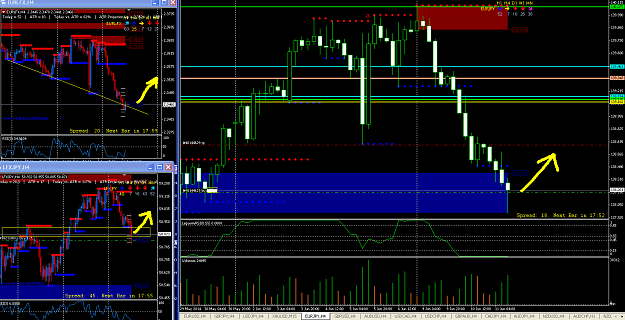
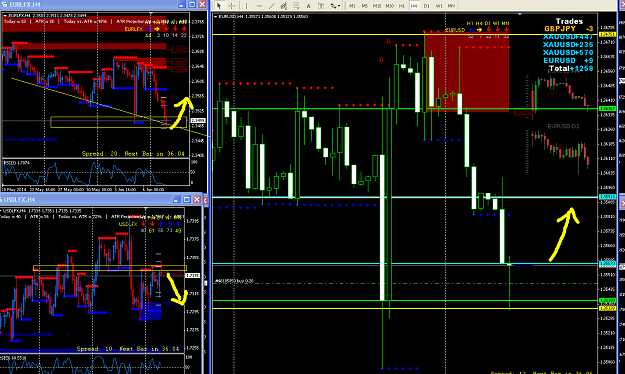
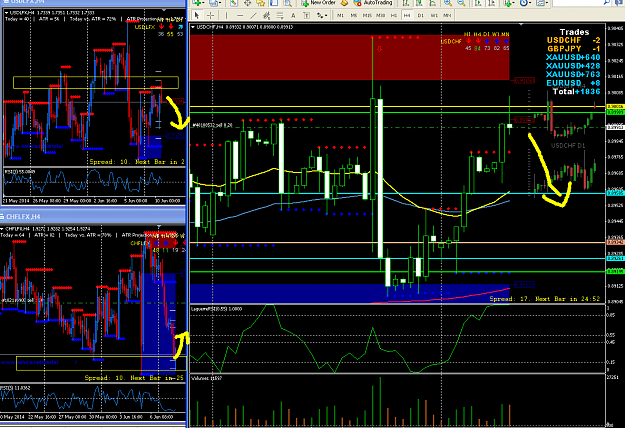
- leekaq replied Jun 10, 2014
EU / US-CHF buy/sell ,,,TAYORRRR
CICR system (Currency index cross referencing)
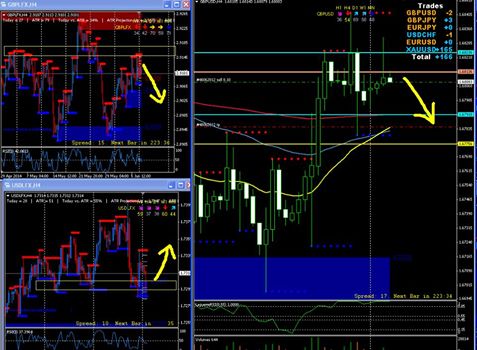
- leekaq replied Jun 9, 2014
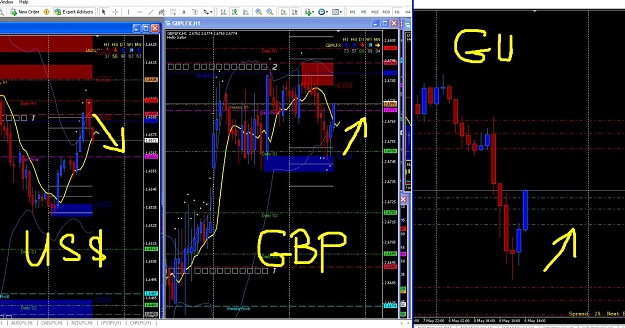
hi guys,, been long time.,... my GU last nite US open....
CICR system (Currency index cross referencing)
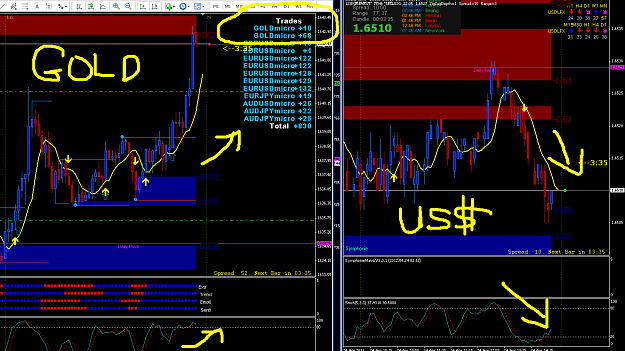
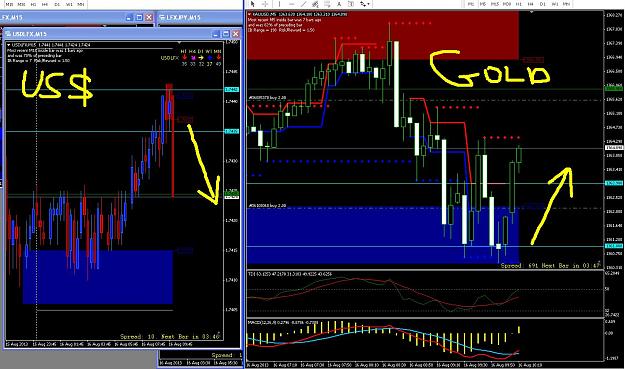
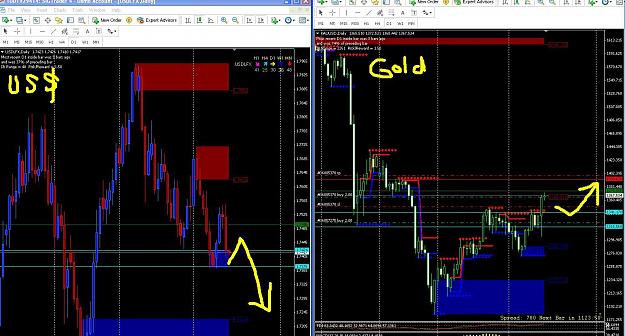
- leekaq replied Aug 16, 2013
quick scalp long at 1362.2.. as US$ index dropped a bit... grab and run..
Only Gold!
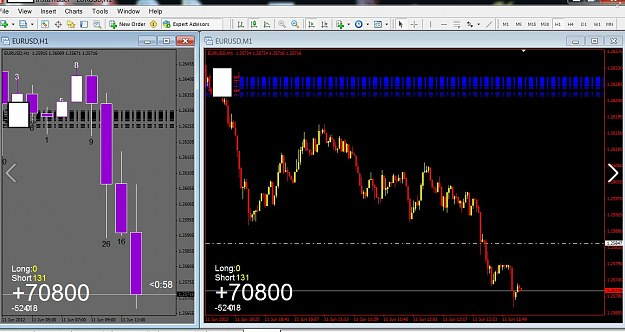
- leekaq replied Jun 11, 2012
most of us barely make 20-30 pips per day but this guy make 70,000 pips just on EU short trades today,,,LOL.. ..
CICR system (Currency index cross referencing)
- leekaq replied Jun 4, 2012
US$ and CAD$ reversal??? — Anticipated reversal on USDCAD pair,,,looks like the swing is still on going,,.. no BP (big player) detected yet so far,,,so the trend could be reverse again,,,grab some pips and run
CICR system (Currency index cross referencing)

- leekaq replied May 22, 2012
it's daily routine guys,,,,just take some extra effort and screen time...i couldn't thanks Capito just enough,,,thanks again Cap for the CICR
CICR system (Currency index cross referencing)
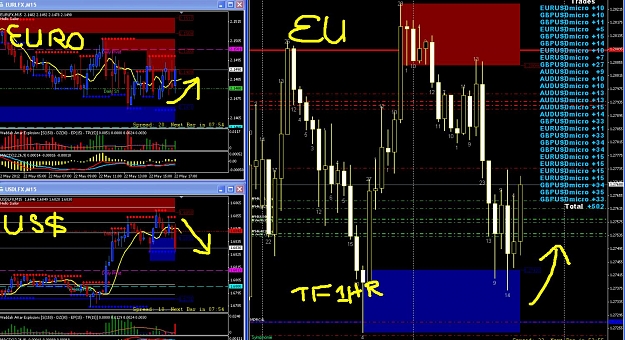
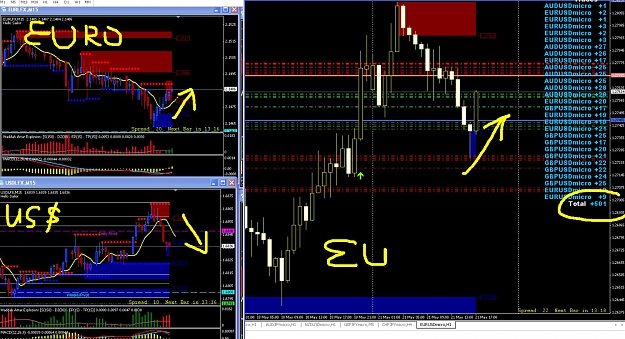
- leekaq replied May 21, 2012
1 hr chart mostly,,,..just get more screen time on the CICR charts and u'll need NO other indi to trade.. today's Asian session trades,,, last nite all trades hit TP (almost 800 pips). here u can see that both EURO and US$ just breached the latest ...
CICR system (Currency index cross referencing)
- leekaq replied May 21, 2012
CICR scalping extreme — done with the bears,,,now is bull's time...
CICR system (Currency index cross referencing)
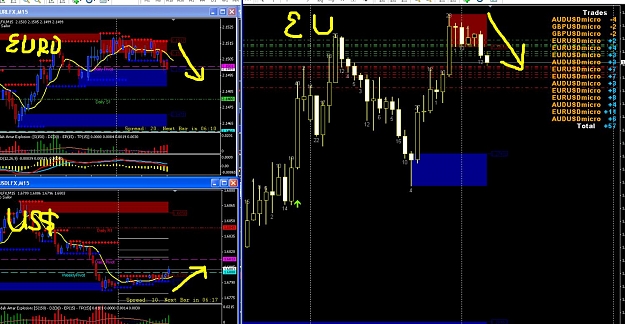
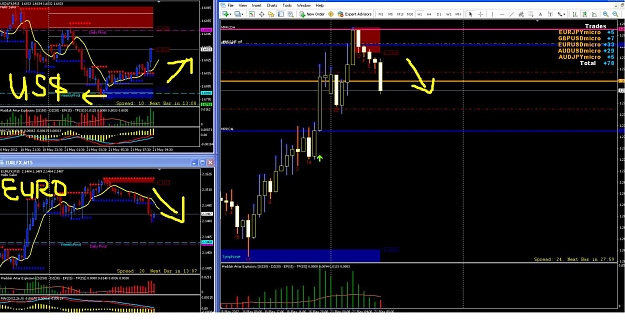
- leekaq replied May 21, 2012
Asia trades — Few ongoing scalps ,,,EU, GU, EJ, AU sells...
CICR system (Currency index cross referencing)
- leekaq replied May 8, 2012
GU quick scalp — just another example on how to use CICR ..current trade im' in..GU, AU, NU, EU buys
CICR system (Currency index cross referencing)
- leekaq replied Apr 25, 2012
now zoom down to AU 5m chart for entry. Here u see price just bounced down after testing the top demand (resistance) level - red box supdem indi.. u can also enter on pull back. .. my TP target is either quick 20-30 pips or next SnR level.. in this ...
CICR system (Currency index cross referencing)
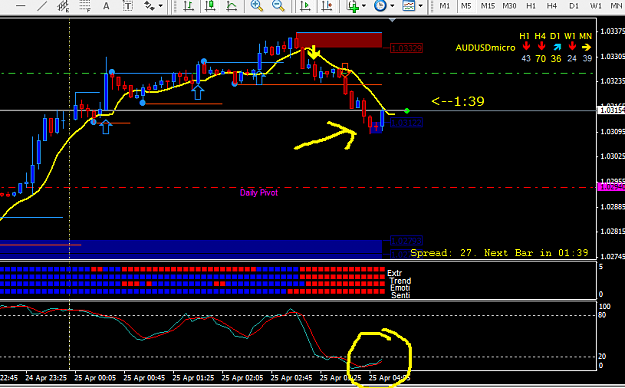
- leekaq replied Apr 25, 2012
open up AU 1 hr chart and u would see the bear candle formed and price is overbought.. the other method is to wait for the symphonie yellow arrow signal.. but i dont really use that as i feel sometimes the signal is too late.
CICR system (Currency index cross referencing)
- leekaq replied Apr 25, 2012
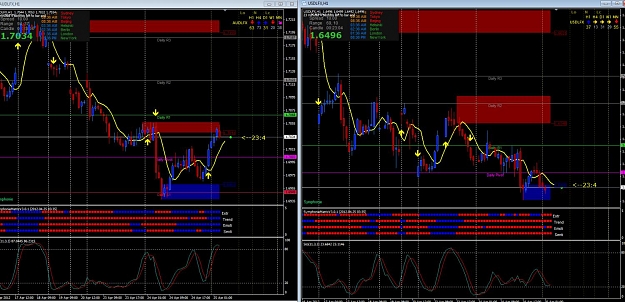
zoom down to M5 TF for details and confirmation on the divergence on both charts. what u see here are almost identical on TF 1 hr.
CICR system (Currency index cross referencing)
- leekaq replied Apr 25, 2012
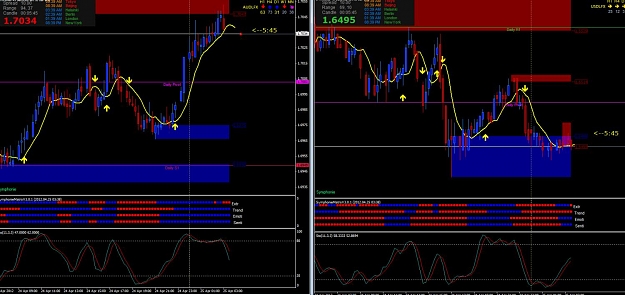
ok let me tell u how i entered the AU trade this morning. I did some screen captures to record my entry details. 1st thing to do is to scan on the indexes, most of the time i use TF1 hr for trend direction. Here I saw, AUD (left chart) price was ...
CICR system (Currency index cross referencing)
- leekaq replied Apr 24, 2012
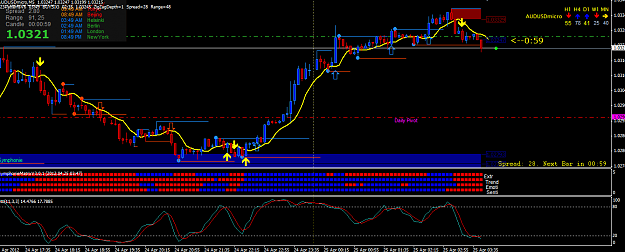
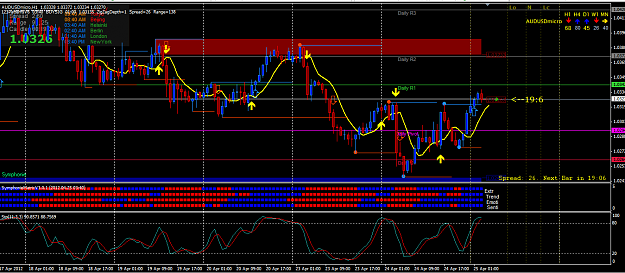
see the support blue box being formed at 1.03095 and stochs oversold.. u can get out here if u want with 10 -12 pips win.. I dont intend to get out yet as i expect more move downward.. look at 1hr chart will tell u why. I closed AU at +15 pips prior ...
CICR system (Currency index cross referencing)
- leekaq replied Apr 24, 2012
AU — I just sold AU at 1.03260 30pips TP and SL.. aiming for TP at pivot... i'll show how i entered later on...it;s bank holiday Australia and NZD anway today. One important point to note is price came down after tested some resistant ...
CICR system (Currency index cross referencing)

- leekaq replied Apr 24, 2012
the same drama script being repeated again and again,,,
CICR system (Currency index cross referencing)