- Search Forex Factory
- 6 Results
- kj8 replied Sep 3, 2013
appreciate your comments and feedback on the long-term analysis. The general trend is bullish, buying range 1340 to 1372 and selling above 1465.
XAU/USD & XAG/USD - Gold & Silver Traders Thread
Attached Image (click to enlarge)

Attached Image (click to enlarge)
- kj8 replied Jul 19, 2011
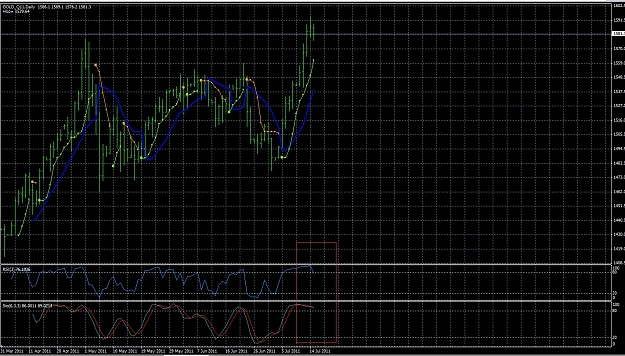
entry at 1599.4 (support in first downfall curve), exit at 1589.9 (weekly low average daily range). The RSI hit 80, representing overbought condition.
This time next year
Attached Image (click to enlarge)

- kj8 replied Jul 19, 2011
The correction in gold ranges between $50 to $100, before reaching to the next level. It's been good day for me today +97 pips. Here is my chart.
This time next year
Attached Image (click to enlarge)

- kj8 replied Jul 17, 2011
US Dollar Index is shows weakness leading EURUSD, Gold and Oil to rise. see attached charts. Feedback appreciated.
XAU/USD Spot Gold
Attached Image
Attached Image (click to enlarge)
- kj8 replied Jul 15, 2011
RSI and Stochastic in the below graph show signs of Gold dropping. However, it may rebound and hit 1605 level today.
XAU/USD Spot Gold
Attached Image (click to enlarge)
- Posts by Member Search: 'kj8'