- Search Forex Factory
- 17 Results
- johnsund replied May 17, 2011
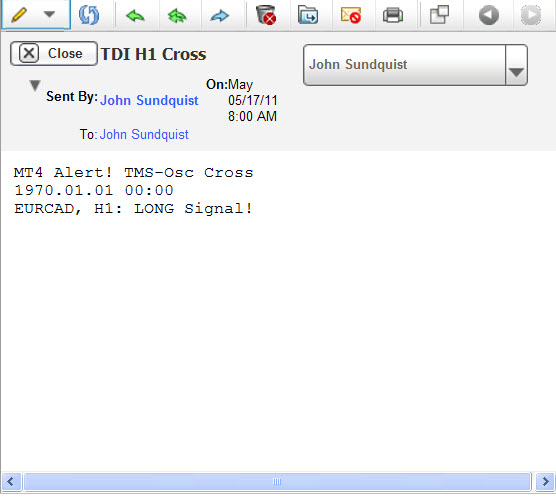
Attached are snaps of the email alert and chart that prompts the question. On the chart note that the vertical green line is on the 8:00am candle (chart time is 10am EDT), yet there was no cross at that time - the cross occurred one candle earlier. ...
Indicators for the 'Trading Made Simple' system
- johnsund replied Apr 6, 2011
Hindsight being what it is here is an update to the NU H4 long trade almost 2 hours later. Got out at .7755 with 31 pips. Price has been as high as .7805, and look at the chart - there is just beginning to be a downturn on the lower (H1) TDI. Live ...
Craig Harris Stochastics Method
- johnsund replied Apr 6, 2011
Took 31 pips on that super fast mover the NU. Signal was there on the H4 chart so....... Probably should have stayed in but got pips and looks like TDI is tipping over. Need to learn to trust more!!!!
Craig Harris Stochastics Method
- johnsund replied Mar 29, 2011
Big E - am looking at GU H4 chart. G > R on prior candle BUT current candle has not closed above 5ema. Do you wait for candle to close above 5ema or just that it moves onto it? Looking down at H1, price clearly in a retrace upwards from strong ...
Craig Harris Stochastics Method
- johnsund replied Mar 23, 2011
David - Opened my demo account on MB Trading and when trying to execute an order got this message. What do I need to do? I normally trade off of MBT desktop, and as far as I can tell VO-PRO is operating normally. Have a monitor chart minimized and ...
VO-Pro: Comprehensive visual order management system for MT4
- johnsund replied Feb 28, 2011
My first chart post. EU on H1 at 8:00 pm last night EST. Yellow vertical lines show candles that were entry and exit candles. Notes show entry and exit prices. For entry, candle price closed just above 5 ema, and had TDI agreement on next candle so ...
Craig Harris Stochastics Method
- johnsund replied Sep 24, 2010
EURUSD price is in the weekly ATR zone. Also, price broke a major psychological at 1.3400. Reversal coming??? Will have to wait and see what happens.
Building an equity millipede
- johnsund replied Sep 24, 2010
USDCHF just broke a major psychological at .9800 and still dropping. Here you can see that price is in the weekly ATR zone, in fact has dropped below it.
Building an equity millipede

- johnsund replied Sep 23, 2010
Took EURUSD short off H4. Several flying buddah's in a row. Entered short just below major psychological of 1.3400.
Building an equity millipede
- johnsund replied Sep 23, 2010
Took a nice Flying Buddah last night on the AUDUSD. Two days of green FB, today price opened lowe with a FB. Entry at psychological of .9850. Good for 50+ pips.
Building an equity millipede
- johnsund replied Sep 21, 2010
In a previous post Graeme said, "If Im looking for sell then I want to see price close below the open of previous up candle." The opposite would be true for an entry rule for a potential long trade. In the case of this AUDUSD trade, price closed ...
Building an equity millipede
- johnsund replied Sep 20, 2010
tjfxtrader - Posted this earlier, but since you mentioned 200 EMA, thought I would show this again. Numbers in purple indicate, in pips, how far price is from the specified moving average. At the time I took this picture, only the price of the ...
Building an equity millipede

- johnsund replied Sep 20, 2010
Only want to consider trade opportunities when a Flying Buddah exists on the D1 chart. For me none others are even a consideration. This helps immensely to screen which pairs may be in play. The red down arrow says the the current price is below the ...
Building an equity millipede

- johnsund replied Sep 20, 2010
Much discussion about where price is in relation to 200 EMA, and whether price is 40 pips above or below it. When a number shows in purple, it indicates for the 5, 10, 50 or 200 period moving average that price is within 40 pips or less of that ...
Building an equity millipede

- johnsund replied Sep 20, 2010
Update to my USDJPY trade taken last night. Not much movement (yet) but still in the trade.
Building an equity millipede

- johnsund replied Sep 19, 2010
Here is a live trade I just entered - USDJPY short. 2 FB in a row, placed order. We'll see what happens.
Building an equity millipede

- johnsund replied Sep 9, 2010
Here is something that may help with the trading approach being discussed here. It shows multiple pairs and multiple timeframes when a flying buddah has formed. You can add and delete timeframes and add and delete which pairs to observe.
Building an equity millipede
- Posts by Member Search: 'johnsund'