- Search Forex Factory
- 50 Results
- johnnyonspot replied Jun 2, 2013
This is a strong shorting candidate given the recently bearish action on the monthly. The 2nd and 4th quarters of 2012 were quite bearish as well, while the 3rd was at best neutral. My plan for trading stocks like these, whether up or down, is to ...
Price action stock trades
- johnnyonspot replied Jun 2, 2013
I saw Disney up on the thread so took a look. The extremely bearish pin bar is obvious, but see how high it rose and how quickly? Like a star dying, shining its brightest before it flames out. Seems like an obvious short. Much the same as Johnson ...
Price action stock trades


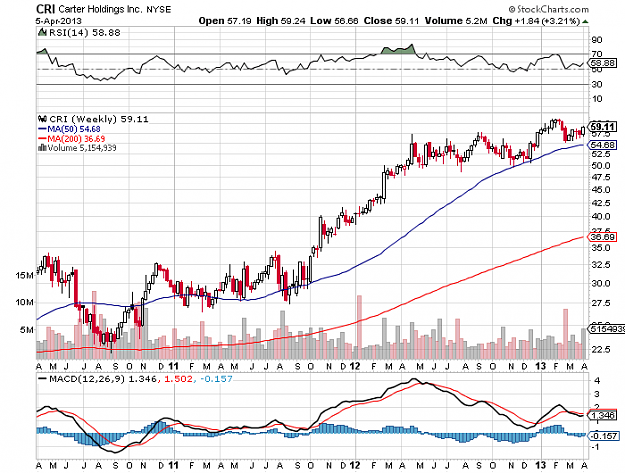
- johnnyonspot replied Apr 7, 2013
I am just as ignorant as the next fella, and again hindsight is 20-20, but my concern with going long on this stock is that its at previous highs as shown on the weekly and monthly charts so I think a breakout would be safer or waiting for it to ...
Price action stock trades
- johnnyonspot replied Apr 7, 2013
When you say you trade with the trend, how do you decide the trend? The weekly chart says up. Hindsight is always 20-20 but I would have difficulty shorting this other than for a quick scalp. This is a bull market after all.
Price action stock trades
- johnnyonspot replied Nov 16, 2012
First time poster on this thread. Indeed, I have not signed in for a long while. But anyway, I think LLY may be a good shorting opportunity. A bearish pin bar on the monthly, at resistance.
Price action stock trades
- johnnyonspot replied Jul 4, 2010
Dow quarterly chart looks very bearish — The quarterly candle on the Dow portends further downside action in equities. I see the nearest decent support zone at the 7,500 area. Could we be seeing the right shoulder of a H&S pattern? Are ...
Silent Service Method

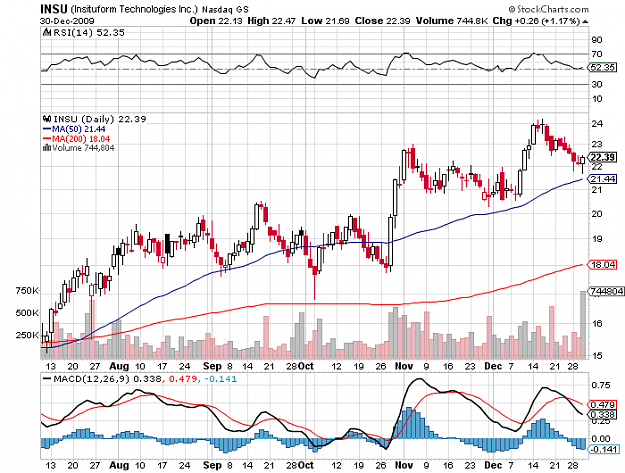
- johnnyonspot replied Dec 31, 2009
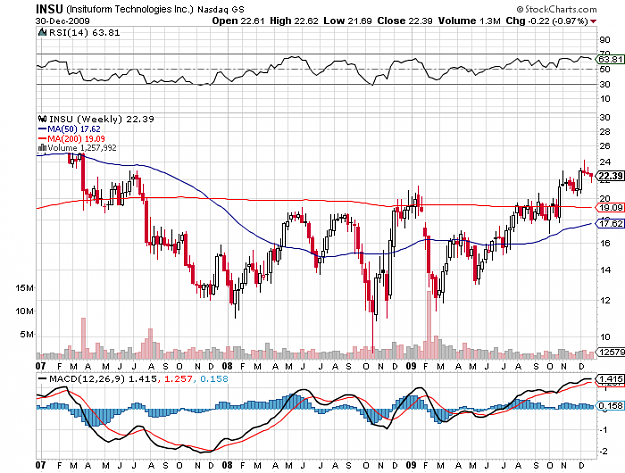
INSU — Chris, I was wondering what your thoughts might be on this setup. It is in an uptrend, recently broke through old resistance on the weekly and has a bullish pin on the daily, off of support. The thing that really catches my eye is the ...
Silent Service Method
- johnnyonspot replied Dec 24, 2009
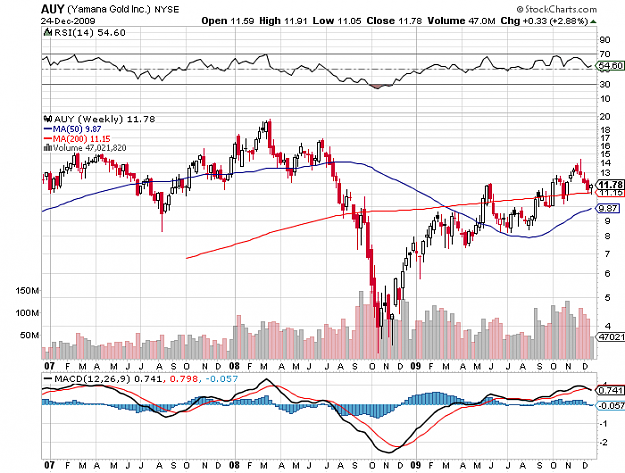
Spot gold weekly pin — Is this bullish weekly pin off support in spot gold the bullish signal we have been awaiting? All of the gold miners I have looked at also have bullish PA. I will be buying some miners next Monday. Here is spot gold ...
Silent Service Method
- johnnyonspot replied Dec 23, 2009
Kiwi — I just read the last several pages here and glad I did. I normally do not watch the Kiwi. I try to limit the pairs I watch because I used to watch over a dozen and that was just too much. Anyway, definitely looks like a nice shorting ...
Silent Service Method
- johnnyonspot replied Dec 15, 2009
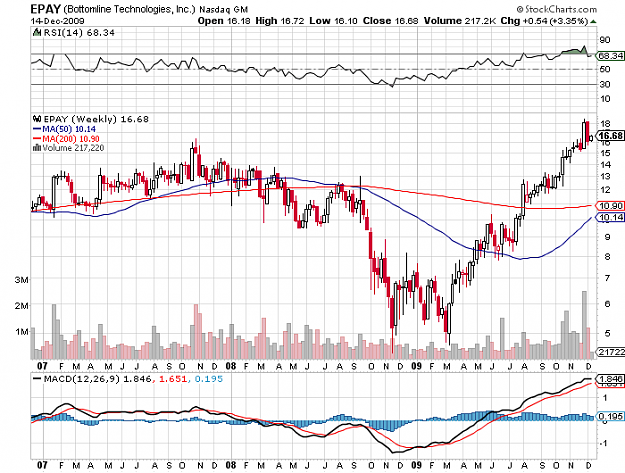
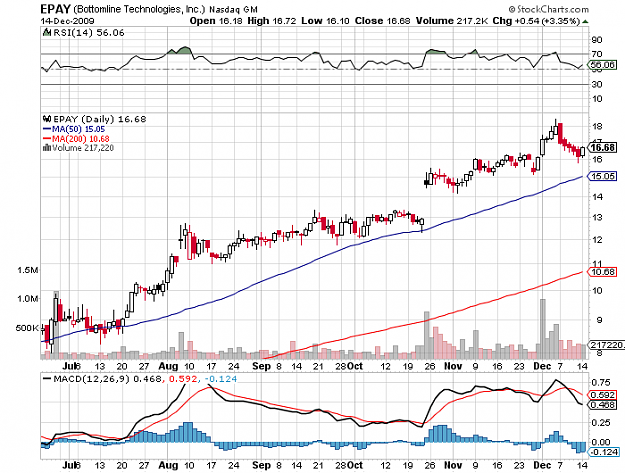
EPAY — Ran across this stock while looking at my volume filter. It burst through resistance around $16 on December 1st and has now retraced back to support and has bullish PA. You cannot see it on these charts, but it is also on its 20 day MA. ...
Silent Service Method
- johnnyonspot replied Dec 15, 2009
GOLD daily: bullish piercing pattern — We have a bullish piercing pattern on the daily chart for gold, also off the 50-day SMA. Is this the bottom of the pullback? I also checked several gold stocks and many are at support with bullish PA. ...
Silent Service Method

- johnnyonspot replied Dec 9, 2009
Potential short on DNB — Dunn and Bradstreet is sitting at a major S/R zone with a triple top and bearish pin bar. Divergence on MACD as well. Here are the weekly and daily charts. Potential short opportunity.
Silent Service Method


- johnnyonspot replied Dec 6, 2009
NVEC — I agree. Another reason is the 200 day MA immediately above, at the top of the potential double bottom. Uncanny how these MAs act as such strong support and resistance. I am testing a strategy that screens for stocks between the 20 day ...
Silent Service Method

- johnnyonspot replied Dec 5, 2009
NVEC at Pivot Zone — Here is a stock that taught me a lesson (I think I learned it anyway) about not trying to buy the bottom. It is a nano tech company and I check in on it every other day or so. Anyway, looking at these charts it seems to be ...
Silent Service Method


- johnnyonspot replied Dec 4, 2009
Gold ready for a pullback — Yes, just what I was thinking when I saw the textbook bearish pin bar from this week. I am not suggesting anyone short gold, but I will be waiting for this pull back to end so I can hop aboard. Combined with the ...
Silent Service Method


- johnnyonspot replied Nov 4, 2009
DJIA Chart — I see a lot of bearish price action on this chart, around the 10k range, a major S/R level imho. We can see a BEOB, followed immediately by a 2-bar bearish piercing pattern, followed a few days later by basically a DHLC, and now a ...
Silent Service Method


- johnnyonspot replied Nov 3, 2009
USDCAD monthly Pin — Anyone else looking at this pin bar on the loony monthly chart. I am looking for it to drop down to the shoulder of the PB or the 61.8 fibo line and then head up. Of course I am also bearish equities so maybe I am ...
Silent Service Method

- johnnyonspot replied Oct 21, 2009
The part about paying for info reminds me of Reminiscences of a Stock Operator where he buys a test lot and if it goes his way then he continues to buy.
Silent Service Method Anyway, been quite a while since I have logged in here. Mostly been sitting around guffawed ...


- johnnyonspot replied Mar 29, 2009
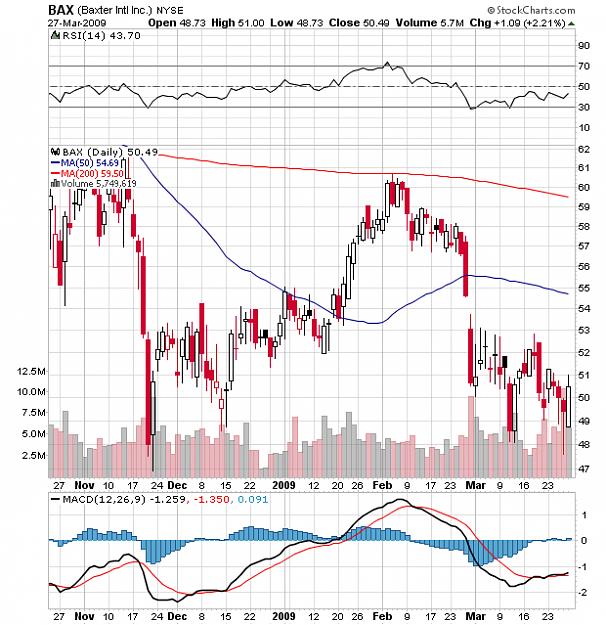
BAX — CW, I am bearish stocks, especially with the indexes bumping up against resistance, but this stock caught my eye. Looks like a double bottom with tons of bullish PA at this level each time it reaches it. How would you rate this setup? It ...
Silent Service Method
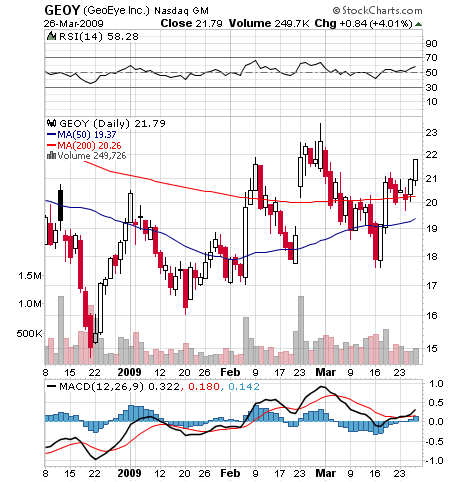
- johnnyonspot replied Mar 26, 2009
A failed trade of mine — The rule CW highlighted a few pages back about giving your trades time and being patient would be paying off for me in this stock trade, if I'd followed it. I am very skittish going long any equity right now. Got into ...
Silent Service Method