- Search Forex Factory
- 64 Results
-
 brian661 replied Nov 24, 2018
AUDJPY Monthly : The long term trend is Bearish. And the Price is consolidating for 4 months. Weekly : The price rejected by the strat shadow and closed below my support with a BEEB. Daily : Fromed a double top last week and get back under the ...
Strat's PASR Long Term, Stress Free Trading


- brian661 replied Nov 24, 2018
I have the same view as suran's post And I did enter a long position this week. Although it finally is a break even trade, I would like to ask a few questions regarding my trade. As my view on this trade is there is support on Big boss support. ...
Strat's PASR Long Term, Stress Free Trading


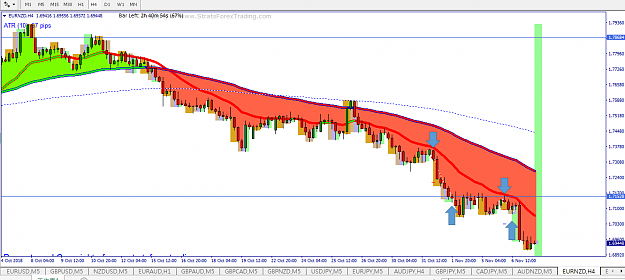
- brian661 replied Nov 16, 2018
As I did not see any good set up in my trade list, I did not trade for the whole last week, except for a re-entry on EURNZD as I saw the strong trend. in total with my first position, +~450pips With the last experience that I am not managing my ...
Strat's PASR Long Term, Stress Free Trading
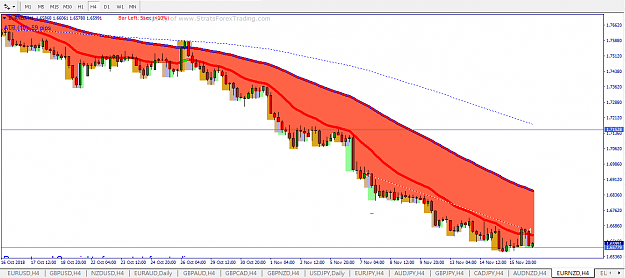
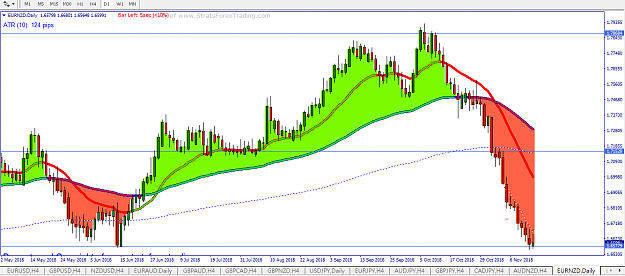
- brian661 replied Nov 7, 2018
EURNZD Close first position for 180pips, at first target on support and 200EMA and an re-entry for 40pips, exited few candle later as I saw the price is consolidated at H4 and not able to from lower low. (wanted to close half but by mistake closed ...
Strat's PASR Long Term, Stress Free Trading
- brian661 replied Nov 4, 2018
AUDJPY Monthly : After a few month consolidation and showing resistance at 200EMA, it continue the down trend Weekly : The price reached Weekly resistance Daily : A long pull back candle on resistance image image image I already enter a small ...
Strat's PASR Long Term, Stress Free Trading


- brian661 replied Nov 1, 2018
The monthly candle close nicely below the previous low. So I wait and found a nice entry as shown with the blue arrow. image While I am wondering where should I target, should I just take profit as it is going to touch the support and 200EMA? ...
Strat's PASR Long Term, Stress Free Trading


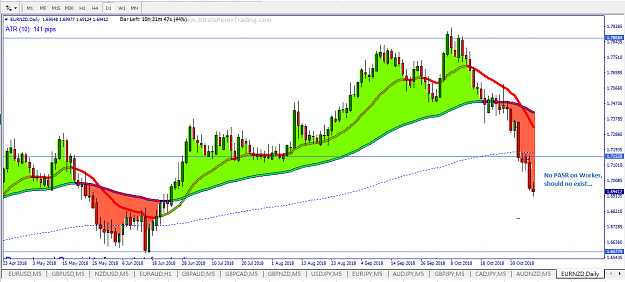
- brian661 replied Oct 29, 2018
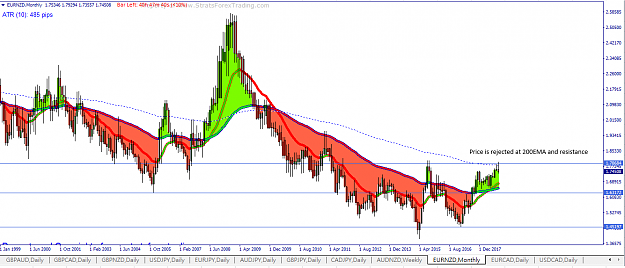
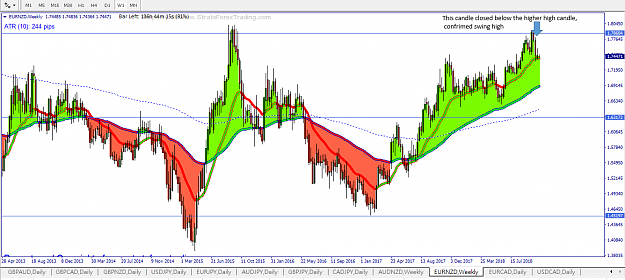
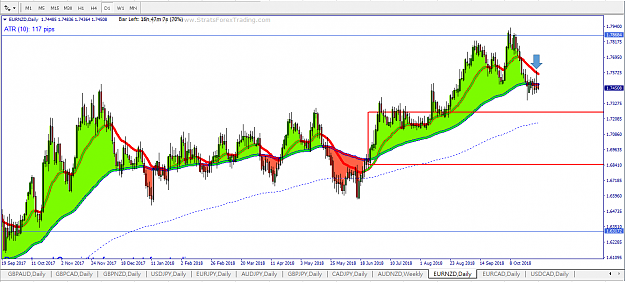
start my work before the sun rise and end my work after my dinner in the last 2 weeks, as a Japanese programmer... Finally I completed my task at 5a.m. this morning and back to analysis after a sleep. EURNZD Monthly : the price is rejejected by the ...
Strat's PASR Long Term, Stress Free Trading
- brian661 replied Sep 30, 2018
EURJPY Big boss : last month price was supported by Strat shadow and support. This month price formed a BUEB Boss : Last week price break WCC and the previous high. While this week is a doji Worker : Retest on previous high and supported as a new ...
Strat's PASR Long Term, Stress Free Trading


- brian661 replied Sep 26, 2018
Feel upset that I do not get profit in the same trade. I tried to trade on 15m trade and saw a setup that yomi may enter. A break of resistance and enter at the first pull back candle. While I after a few hour, there is still fail to getting higher ...
Strat's PASR Long Term, Stress Free Trading

- brian661 replied Sep 15, 2018
Weekly report This week just enter two trade, but no profit is taken. AUDZND H4 A retest of resistance at the resistance area, where it formed a long shooting start at the last swing. entered at the small shooting start at the blue arrow. image ...
Strat's PASR Long Term, Stress Free Trading


- brian661 replied Sep 9, 2018
After last week Strat suggested me to change the time frame I trade. This week I tried to focus on H4 Day Month chart, and I feel quite suit my life. Now I only trade on the support or resistance that I have confidence on it. Although I can only ...
Strat's PASR Long Term, Stress Free Trading

- brian661 replied Aug 24, 2018
Thanks darko, I have look at the H4 and D1 before I enter trade. I just went back to the USDCAD H4, and I found myself missing the purple resistance line... And always not able to enter at the beginning of a trend on the SR. Yes I have read Strat's ...
Strat's PASR Long Term, Stress Free Trading

- brian661 replied Aug 24, 2018
Got a 30pips small trade on AUDNZD H1, after a long wick hammer above the support and a re-test on the red line support. closed slightly below the resistance. image And a 30 pips lost on USDCAD. enter at the pull back on 200EMA & support. but got ...
Strat's PASR Long Term, Stress Free Trading


- brian661 replied Aug 18, 2018
Hi Strat, I find the support I draw myself are having a large different from yours, taking the below EURUSD as a example, your price are still above the support, but mine is already became a new resistance. When I draw the support, I try to find a ...
Strat's PASR Long Term, Stress Free Trading


- brian661 replied Aug 14, 2018
audnzd monitor for few hours but just got 15pips Enter at the second pull back candle because I want to see the trend in London session. So wait for the second PA candle. Exit at the support, when the price cannot break it at the second try image
Strat's PASR Long Term, Stress Free Trading

- brian661 replied Aug 13, 2018
A lost on EURAUD 5minutes trade enter at the 3 reject of resistance. But got stop out at 10pips above the resistance. Should I not enter the trade because candles have many wicks and going up and down of the shadow? image
Strat's PASR Long Term, Stress Free Trading

- brian661 replied Aug 11, 2018
USDCAD Monthly : See buyer from the blue arrow. Trend line was broken. Weekly : BUEB this week on the support Daily : Price are not able to break the support area in last 2 week and Friday closed with a large bullish candle with small wick. Will try ...
Strat's PASR Long Term, Stress Free Trading


- brian661 replied Aug 11, 2018
Hi everyone, sorry for disappeared for a week as I was busy for my job and my broker disabled their service in Japan. So spent some time on search for a new broker. Working on my weekly analysis. EURUSD Monthly : After rejected by 200EMA twice, the ...
Strat's PASR Long Term, Stress Free Trading


- brian661 replied Jul 24, 2018
5 minute trade on EURAUD +35pips I enter because of: London developed a nice down trend, and at the opening of New York, a BEEB with a pull back candle. Exit at the BUEB above the 4h support image
Strat's PASR Long Term, Stress Free Trading

- brian661 replied Jul 24, 2018
Thanks darko, rufus and Strat, On Big boss chart, should I look that far to identify the L-H-HL structure? If I look with shorter time range, 4 years, I will draw a H-L-LH struture How should I design how long I should look for? image For the time ...
Strat's PASR Long Term, Stress Free Trading
