- Search Forex Factory
- 9 Results
- blackmovie replied Jan 5, 2015
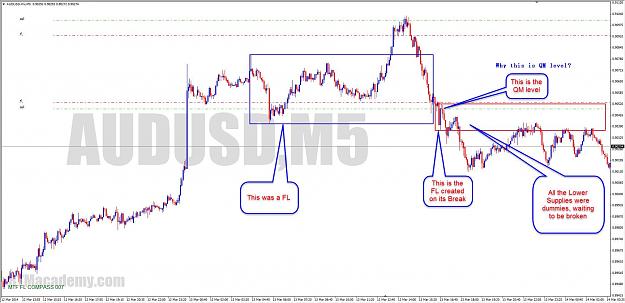
Hi , the following chart is one of IF's chart, I cant understand the 'QM level' in the following chart, Can anyone point out the Hs and Ls if the QM in the charts? Thanks in advance!
ReadtheMarket - Supply and Demand with Price Action
- blackmovie replied Jun 13, 2014
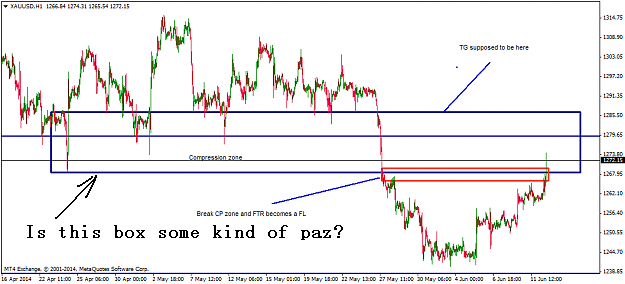
Hi fxyogi, Thanks for your contribute to us, about one of you chart you posted, I have a question, would you explain it further please? Thanks! See the chart below.
ReadtheMarket - Supply and Demand with Price Action
- blackmovie replied Aug 4, 2010
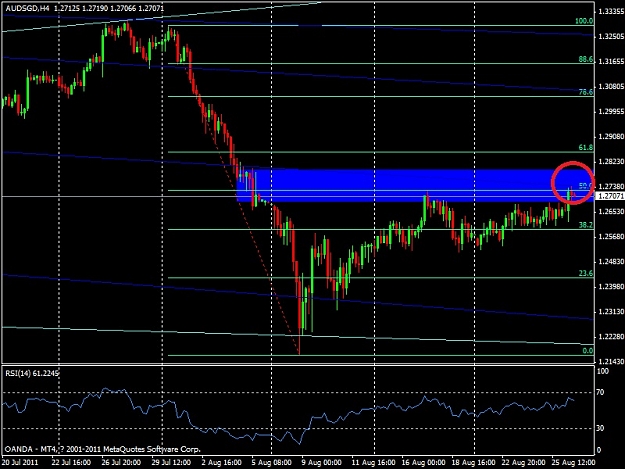
price break out the lower red TL of the triangle and retest,show two pin bar then I'm in . any comment?
Intraday price action trend trading
- blackmovie replied Oct 14, 2009
sorry trendman, please forgive my newbie question: where is the divergence at the moment?
Trendman scalping system

- blackmovie replied Aug 21, 2009
sorry Glen, where is the buy arrow right at the blue line?
MTF Trix system

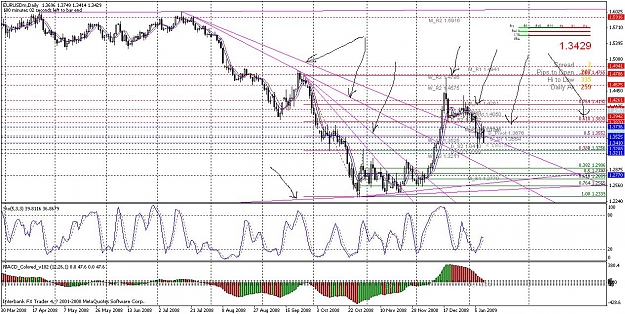
- blackmovie replied Jan 11, 2009
lines — thank you simpleguy. but you may not understand me. I know PA=price action, I mean how to close trade according to PA which described in FJ's rules ? some example? another question: see the chart below, the trend lines and Fibo lines ...
The Force 5min system
- Posts by Member Search: 'blackmovie'